



Quarterly Outlook • July 16, 2026
Corn’s Disappearing Carryout

Report Snapshot
Situation
Large corn supplies are grabbing headlines, but demand is quietly shrinking the carryout cushion.
Outlook
The big story of the 2026 crop may be how quickly demand erodes supplies over the next 12 months. If export, feed and ethanol demand remain on their current trajectory, corn carryout could shrink significantly faster than the USDA projects.
Impact
Without a Chinese buying spree or weather concerns heading into harvest, expect December 2026 corn prices to face seasonal harvest pressure, but stronger-than-expected demand clears a pathway for post-harvest cash contracts to rally above $5/bu. by early 2027.
On June 30, the USDA released the quarterly Grain Stocks report and 2026 Acreage report. The USDA forecasts corn area planted at 95.3 million acres, down 3.5% from last year but up slightly from the March report given favorable spring weather. Notably corn acreage for 2026 is the fourth-highest planted area in over eight decades. Corn area left to be planted was 1.9 million acres. The USDA estimated quarterly corn stocks at 5.295 billion bushels (BBU), which was well below analysts’ estimates of 5.3 BBU to 5.5 BBU and confirmed strong demand usage.
Weather for the remainder of the growing season will ultimately determine final yields and production for the new-crop year. However, total production given the June acreage and Terrain’s forecast yield estimates would be 16.04 BBU, down nearly 6% from last year but still the second-largest crop on record.
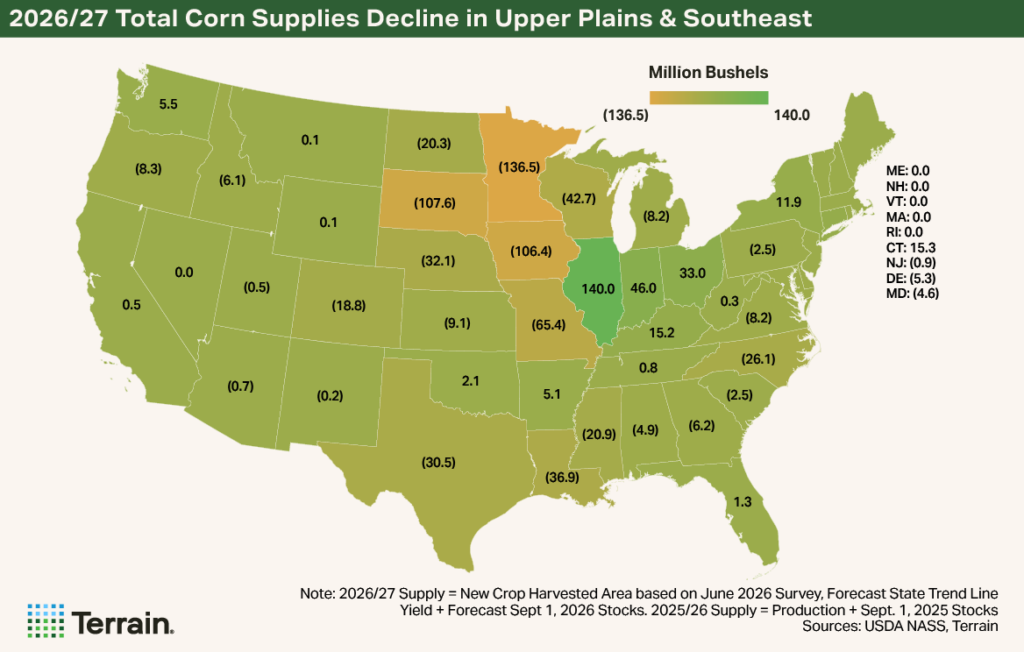
New-crop 2026/27 supplies in the western corn belt and upper Plains are forecast to draw down year over year (YOY), which could help improve basis for the farmer.
Stocks Surprise
New-crop 2026/27 supplies in the western corn belt and upper Plains are forecast to draw down year over year (YOY), which could help improve basis for the farmer. Even though planted and harvested corn acres are expected to decline in 2026, high-yield states in the eastern corn belt such as Illinois, Indiana and Ohio could see new-crop supplies rise YOY due to larger old-crop carryover stocks.
June stocks increased 14% YOY to 5.29 BBU because of record old-crop production of over 17 BBU and total supplies (including previous crop carryover) of 18.6 BBU. However, the record U.S. supply is met with record demand in both exports and domestic consumption at 16.58 BBU for 2025/26. In the July World Agricultural Supply and Demand Estimates (WASDE), the USDA increased Feed and Residual demand another 150 MBU to 6.35 BBU, further reducing carryover supplies.
Based on actual sales through the week ending July 2, 2026, the USDA reported total old-crop corn export commitments at 3.384 BBU. This exceeds the USDA’s July WASDE forecast of 3.325 BBU for 2025/26 with nine weeks left in the old-crop marketing year. I forecast 2025/26 corn exports finish at 3.375 BBU, 50 MBU higher than the USDA’s July forecast. (When considering trade seasonality and that for the past 10 years, on average, 3% of total export commitments are unshipped and roll into the subsequent crop year’s beginning stocks and exports.) This would also decrease beginning stocks accordingly to 1.97 BBU for 2026/27.
While a 50 MBU difference may seem small relative to total supplies, every reduction in carryout brings the market one step closer to a tighter balance sheet and improved pricing opportunities for producers.
All Aboard
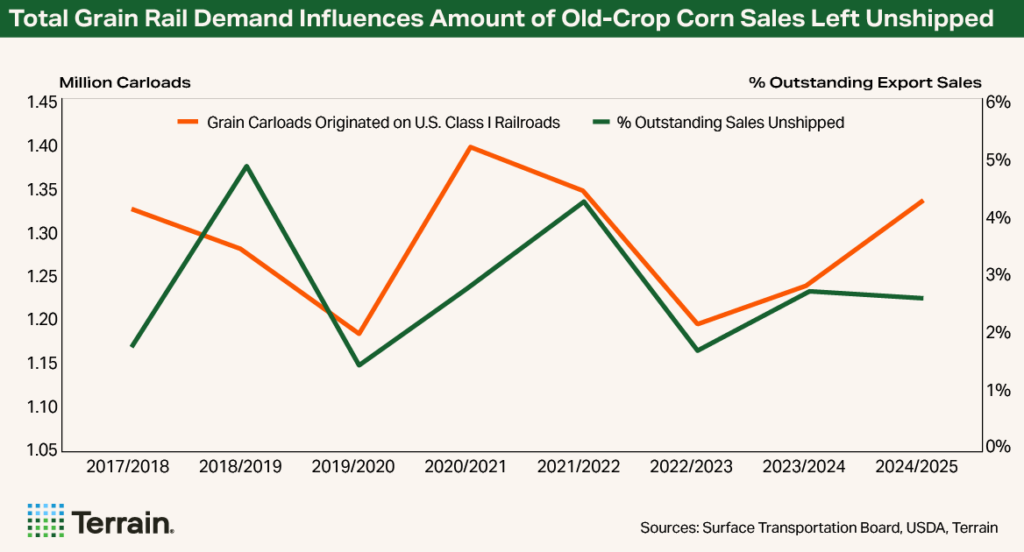
Transportation largely determines how efficiently the U.S. executes export sales. (Primarily rail and barge, with peak demand for freight following harvest.) After soybean export shipments are seasonally executed, rail and barge capacity typically increases, allowing other grains to increase shipments.
While nearly 60% of U.S. grain exports ship via barge on the Mississippi River, total shipments are down 15% YOY, placing a higher emphasis on rail service and grain shuttle supply. According to the Surface Transportation Board, through June 2026, U.S. grain carloads are up over 13% YOY.1 However, forward freight demand indicators for July and August show secondary shuttle freight for Western railroads are trading at a discount to tariff rates, indicating surplus freight is available.2 This would be primarily led by reduced wheat exports (given U.S. hard red winter wheat production for 2026 is down over 40% YOY).
For the week ending July 9, 2026, shuttle trains for July and August delivery traded below the seasonal three-year average. Improved freight availability could help facilitate additional corn export execution. This could increase old-crop exports by an additional 30-70 MBU, finishing full-year exports beyond 3.4 BBU. This would also minimize the number of unshipped sales rolling into the new marketing year’s beginning stocks and tighten up the supply side of the balance sheet.
China Could Light the Fuse for New-Crop Demand
Following the U.S.-China trade meeting in May, the White House issued a Fact Sheet indicating China agreed to purchase an additional $17 billion in U.S. agricultural products annually through 2028 (beyond the annual soybean commitment of 25 million metric tons per year).
The reported agreement with China comes as global demand continues to outpace supply, with the USDA forecasting global corn stocks-to-use at 18% in 2026/27, among the lowest levels of the past decade (-2% YOY ).
Combined with current import barriers such as tariffs and quotas, doubt lingers on big Chinese corn buys.
At the same time, the duration and hangover effects of the conflict in Iran to both global crude oil and fertilizer supplies also leave future global corn production questionable. Any potential global pullback will tighten corn supplies even further, plus any confirmed purchases from China could result in a sharp rally and provide pricing opportunities for farmers.
Keep in mind China is the second-largest global producer of corn and relies on only 1% of imports for its total domestic supply. For the past five years, China had record domestic corn production with the USDA forecasting another 2% increase in 2026/27. Combined with current import barriers such as tariffs and quotas, doubt lingers on big Chinese corn buys.
If we see new-crop exports continue at a similar pace to 2025/26, the USDA could again be understating export demand. If U.S. new-crop exports were to rise another 175 MBU (to my old-crop export forecast of 3.375 BBU), at the same time 2026/27 beginning stocks are reduced (due to USDA understating old-crop exports by 50 MBU), ending stocks would be 1.565 BBU.
For new-crop 2026/27 supplies, weather during July and August will have the ultimate say in U.S. production and yields.
Shrinking Carryout Lends Optimism to New-Crop Prices
After several years of lower corn prices and tightening farm margins, many producers are questioning whether demand will be strong enough to support a meaningful recovery. While the market remains focused on acreage and yield potential, demand may prove to be the more important story over the next 12 months.
Terrain’s outlook differs from the USDA’s primarily because current export commitments, transportation indicators, and global inventory trends suggest export demand could exceed the USDA's current forecast. For new-crop 2026/27 supplies, weather during July and August will have the ultimate say in U.S. production and yields. The window for a weather threat is quickly closing, so if favorable conditions develop, expect prices to trend downward as they typically do seasonally heading into harvest.
While the export pace shows no signs of slowing, domestic demand also continues to do heavy lifting as we move to the new-crop year:
- Consumer demand for protein and livestock production trends continue to support feed demand.
- Ethanol and the biofuel industry have positive momentum building for nationwide, year-round E15, although the Senate needs to push this across the finish line.
- Clarity on the federal 45Z $1/gallon biofuel producer tax credit continues to unfold, supporting stronger ethanol margins and corn processing.
If demand continues to outpace the USDA's current projection and 2026/27 ending stocks fall below 1.6 BBU, corn prices could return above $5/bu. by early 2027 as stocks-to-use approaches 10%. The USDA’s current comfortable corn carryout could disappear faster than the market expects.
Endnotes
1 U.S. Class I rail carrier grain carloads originated
Railroads periodically auction guaranteed grain car service for an individual trip or a period of time (e.g., one year). This ordering system is referred to as the “primary market.” Once grain shippers acquire guaranteed freight on the primary market, they can trade that freight with other shippers through a broker. These transactions are referred to as the “secondary market.” Secondary rail values are indicators of rail service quality and demand/supply. Shuttle bids/offers are for shuttle trains — 110+ grain cars that travel from a single origin to a single destination. Sources: USDA Agricultural Marketing Service analysis of data from the Malsam Company.


Terrain content is an exclusive offering of AgCountry Farm Credit Services,
American AgCredit, Farm Credit Services of America and Frontier Farm Credit.