


Report Snapshot
Situation
Many growers in the Central Valley have removed walnut orchards in recent years as the industry confronts a variety of headwinds. Some of these challenges are ones that other nut crops are also facing, such as increased growing costs. Though the decline in profitability and acreage in the walnut market is partly attributable to these common obstacles, there are also unique barriers to the long-term success of the California walnut industry.
Finding
Despite these challenges, it is likely that 2022 was the perfect storm of negative factors that will mark the very worst of the recent market downturn.
Outlook
The walnut industry’s unique challenges, combined with headwinds facing agriculture in the state more broadly, are likely to flatten California production and pricing going forward.
Challenges for California Walnuts
Over the past two years, many growers in the Central Valley have removed walnut orchards as the industry confronts a variety of headwinds within California and abroad. Some of these challenges are ones that other nut crops like almonds and pistachios are facing — namely, increased growing costs; a stronger dollar, which has made U.S. ag exports more costly to buyers overseas; and the implementation of retaliatory tariffs starting in 2018. These challenges have been especially difficult for walnut and almond growers, whose rising costs have been accompanied by the lowest pricing in decades.
These obstacles have contributed to the negative bottom lines of growers and the recent numbers on bearing acreage. Many walnut growers have lost anywhere from $500 to $1,500 per acre in recent years, though this varies widely depending on region and operation. Given these losses, many farmers have decided to pull acreage, as confirmed by the 2023 USDA California Walnut Objective Measurement Report.1 Bearing acreage declined approximately 6% from 400,000 acres in 2022 to 375,000 in 2023, according to the report.
Though much of the impact on the walnut market can be partially attributed to these common obstacles, there are three unique barriers to the long-term success of the California walnut industry that are not shared by other California nut commodities:
- Slow domestic demand growth in the U.S.
- Increased competition from abroad
- The dominance of one variety
These challenges have been especially difficult for walnut and almond growers, whose rising costs have been accompanied by the lowest pricing in decades.
What Happened to Demand?
While domestic almond and pistachio aggregate consumption has increased 132% and 232%, respectively, since 2003, walnut consumption has increased only 121% (see Chart 1).
The lackluster demand growth is partly a result of walnuts being purchased primarily in the baking aisle — a section of the grocery store that, before the spike in home baking during COVID-19 lockdowns, had exhibited less than stellar growth. From 2016 to the start of the pandemic, sales of baking mixes and ingredients were in decline.2
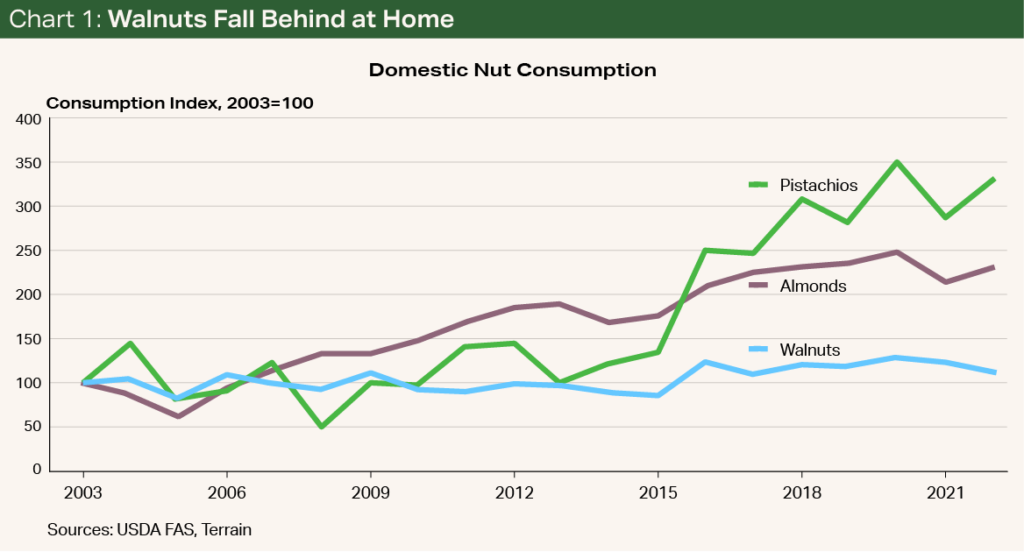
This contrasts with the appearance of almonds in a wide array of products, from cereals and candy to the almond oil used in skincare products. Pistachios, while less versatile than almonds, have enjoyed incredible growth as the ideal snacking nut, appearing in grocery stores, gas stations and airports.
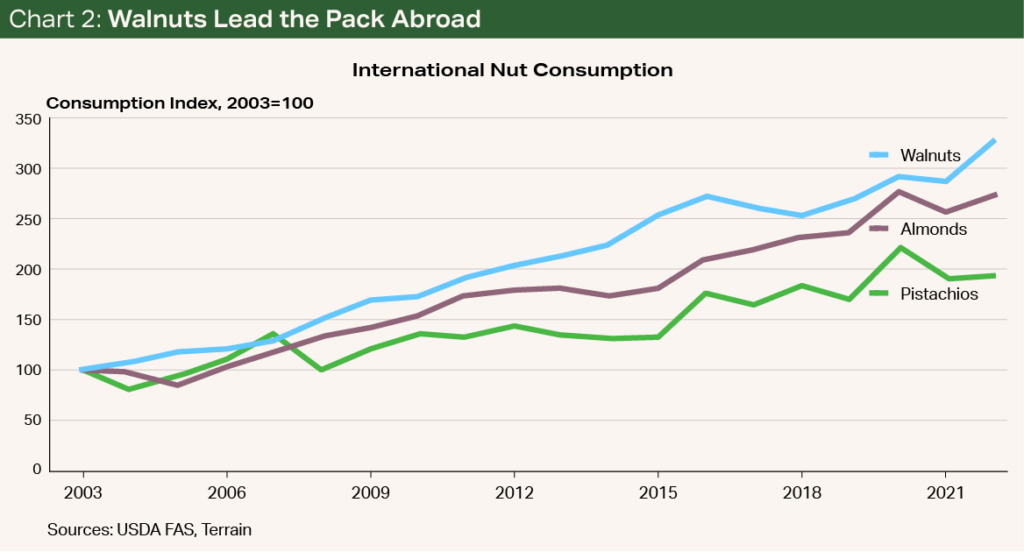
The relatively slow domestic growth of walnut consumption contrasts with the international market, where walnuts have led the pack.
Interestingly, the relatively slow domestic growth of walnut consumption contrasts with the international market, where walnuts have led the pack.
International consumption of almonds and pistachios has grown 175% and 94%, respectively, in the last two decades while walnut consumption has grown 229% (see Chart 2). This is especially impressive given the walnut market is much larger by comparison. Whereas annual world almond consumption is somewhere in the 2.8 billion- to 3.5 billion-pound range and pistachio consumption is in the 1.4 billion- to 1.9 billion-pound range, walnut consumption is a massive 4.4 billion to 5.8 billion pounds, with China, the EU, the U.S. and Turkey being the largest markets.3
Though much of the growth in aggregate consumption globally is a result of many countries’ populations getting larger and richer, it is worth noting that U.S. walnut consumption is still low on a per capita basis compared with countries with comparable levels of income and tastes. Comparable regions and countries, such as Europe and Australia, consume many more walnuts per capita than the U.S. Whereas the typical American consumed an average of 1.33 pounds of walnuts annually in the last five years, the typical Australian consumed 1.69 pounds and the typical European consumed 2.01 pounds.3,4
Though it is impossible to fully account for consumption differences, cultural differences in the uses of walnuts may help explain the per capita consumption gap.
Though changing consumption habits is difficult, understanding and attempting to cultivate the habits and uses of other countries may help stimulate demand at home.
According to a report from the USDA Foreign Agricultural Service, per capita walnut consumption in Australia has been rising because of the health consciousness of the population. The report also highlights walnuts’ versatility as an ingredient.5 A separate USDA report notes that Europeans also view walnuts as a healthy option, in addition to using them in a variety of traditional dishes around the holidays.6
Though changing consumption habits is difficult, understanding and attempting to cultivate the habits and uses of other countries may help stimulate demand at home.
The Competition Heats Up
Despite the slow growth in domestic demand, it may seem the increase in global demand would have been a boon for California walnuts in the last few decades. The upturn, however, has also been met by a rise in global competition from walnut-growing countries like China and Chile.
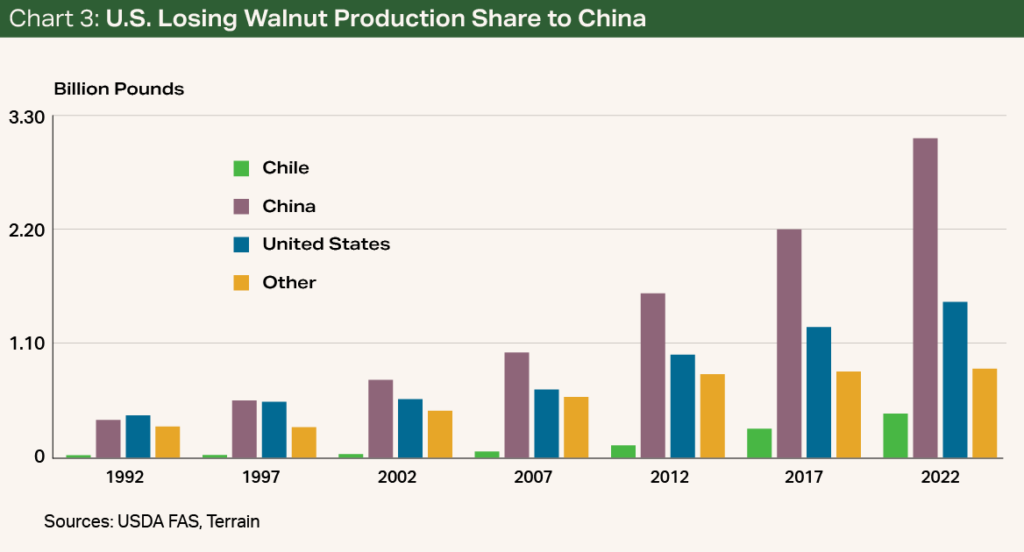
Whereas U.S. production (which is typically in the 1.5 billion- to 1.6 billion-pound range) accounted for 37.4% of global production in 1992, it accounted for 25.5% in 2022 (see Chart 3). This is largely because of the increase in walnut acreage in China, which produces 3 billion pounds (about 52.5% of the global market) and Chile, which produces 423 million pounds (7.2% of the global market).3
Unsurprisingly, the fall in production proportion has translated into a decline in the American proportion of walnuts exported globally as well.
Whereas the U.S. accounted for 62% of all walnut exports in just 2012, it now constitutes 42%.
While Chile has always exported most of its crop, China’s production has traditionally been consumed domestically. From the 2017/2018 crop year to the 2021/2022 crop year, however, China’s walnut exports by weight increased by over a factor of five. Whereas the U.S. accounted for 62% of all walnut exports in just 2012, it now constitutes 42%.3 Furthermore, China is exporting its walnuts to some of the regions and countries that the U.S. and Chile have historically sent theirs to, such as Europe, Turkey and the UAE.7
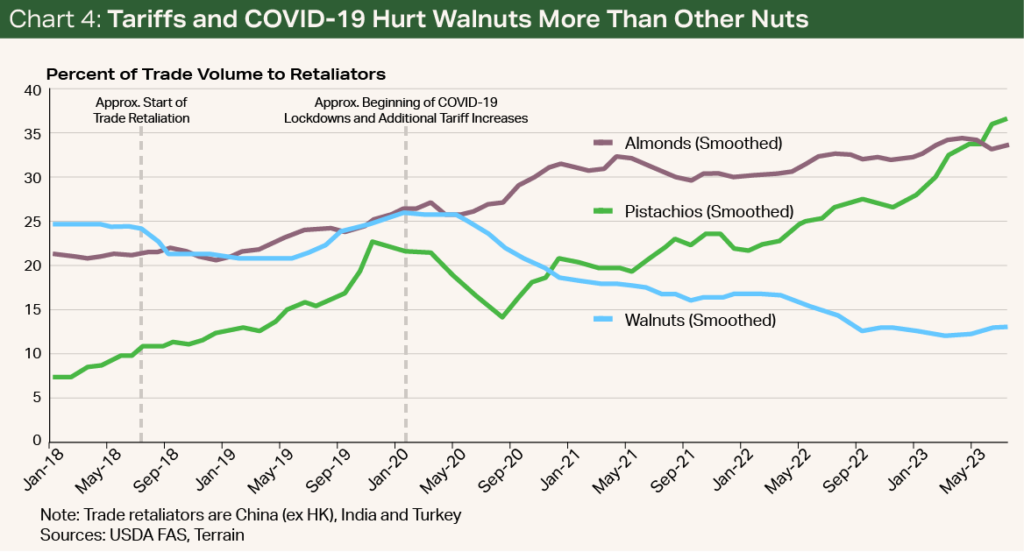
The increase in competition has been made worse by retaliatory tariffs put in place by India, China and Turkey on many U.S. nut commodities beginning in 2018. U.S. producers were hit particularly hard in part because China’s applied tariff rate on walnuts was higher than that on almonds and pistachios.8
Though trade flows can be difficult to parse, since there are many other factors that play a role (appreciation of the dollar, for instance), the retaliatory tariffs combined with COVID-19’s effect on redrawing trade flows resulted in walnuts experiencing a lower percentage of trade volumes going to retaliators, but not almonds and pistachios (see Chart 4).
What appears to be the most important factor here is China importing fewer American walnuts after the tariffs were established.
The Continued Rise of Chandlers
The final obstacle is on the production side.
Unlike almonds, where there are many marketable varieties, or pistachios, where variety is not important to most buyers, a single variety is slowly taking over the walnut market.
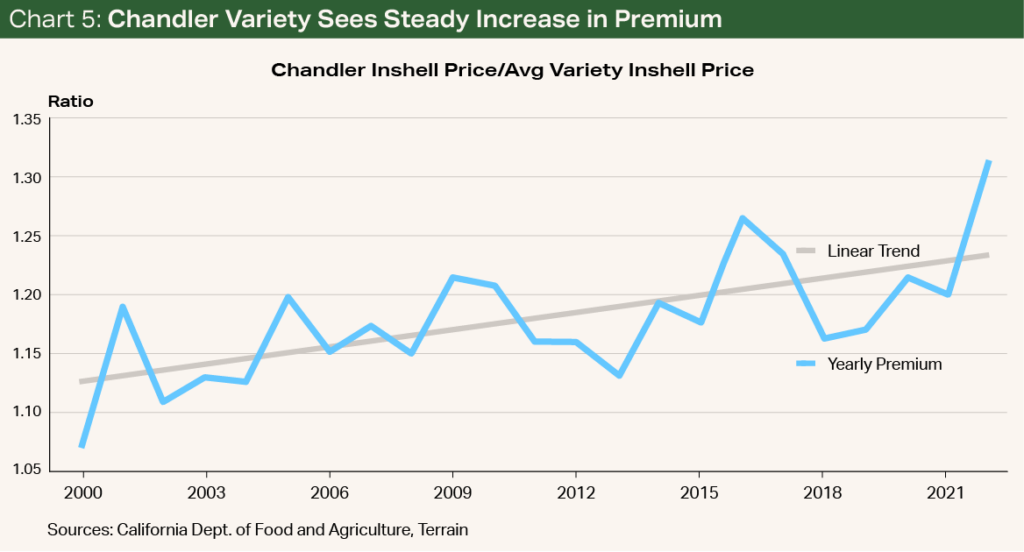
Since their introduction in the late 1970s, Chandlers have proven easier to market for the light color of their kernels. This marketability has translated into a higher price relative to other varieties.
Over time, this relative premium has increased, which proved especially important in 2022 when the crop had major quality issues (see Chart 5). Throughout the years, growers have responded to this consumer demand by planting more and more acreage. According to the USDA, Chandlers represented less than 10% of total bearing acreage in the mid-1990s; today, they represent over half.
Unlike almonds, where there are many marketable varieties, or pistachios, where variety is not important to most buyers, a single variety is slowly taking over the walnut market.
The dominance of Chandlers has made it difficult for growers with older varieties like Vinas and Serrs that have lost popularity among handlers and consumers. This is especially true when the crop faces quality issues like it did in 2022, when even Chandlers are difficult to market. Furthermore, as the U.S. faces increased competition from overseas, delivering a walnut that meets the specifications of most buyers is crucial.
Though there are new varieties that have been developed, such as Wolfskill, none have been able to show the promise of Chandlers.
While walnut planted acreage was down across varieties in 2021, there were 1,904 acres of Chandlers planted, compared with 290 of the next most popular varieties combined, according to the 2021 USDA nursery sales report (this excludes the sales of root stock that will be grafted later).9
At their current rate of growth, Chandlers are likely to become 60% of total bearing acreage by 2026.
At their current rate of growth, Chandlers are likely to become 60% of total bearing acreage by 2026. This number could prove even higher as growers with non-Chandler varieties choose to remove their older varieties, which are less marketable and, therefore, sold at a lower price.
Moving Forward
Examining the challenges facing the California walnut industry begs the question: Where do walnuts go from here?
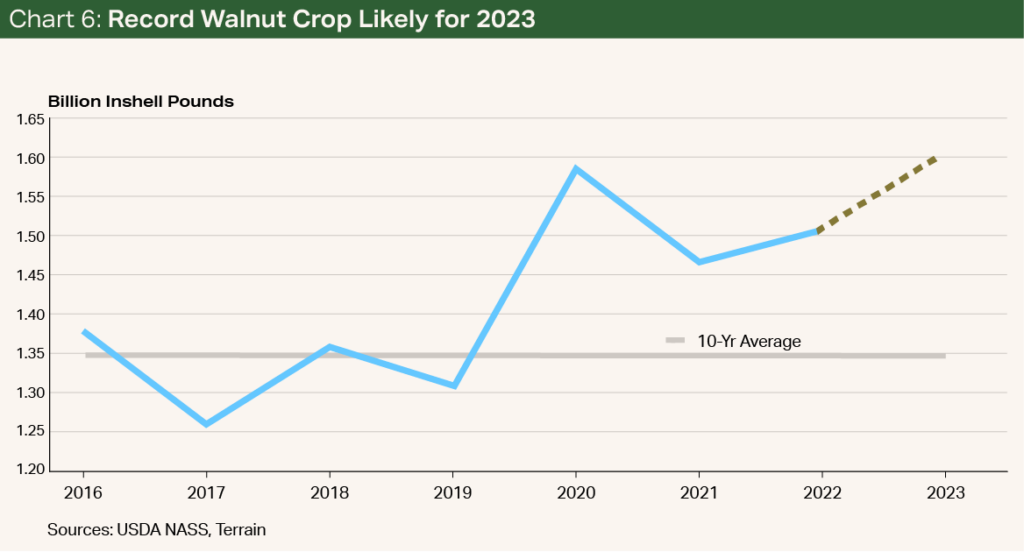
In the short term, there is no doubt that the 2023 crop is large despite the decline in bearing acreage.
The 2023 USDA Objective Measurement Report forecast 4,060 inshell pounds per acre and a total production of 1.52 billion inshell pounds.1 Cumulative crop receipts have already surpassed that number, with the most recent figure standing at 1.59 billion inshell pounds, implying an average yield of 4,263 inshell pounds per acre (see Chart 6).10
Examining the challenges facing the California walnut industry begs the question: Where do walnuts go from here?
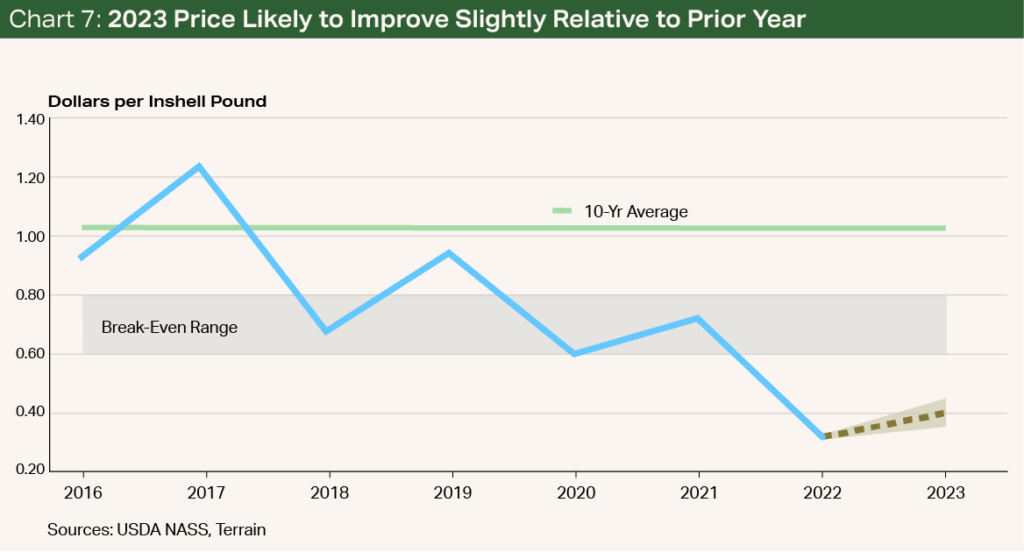
With such a large crop in 2023, a natural concern is the lower pressure on price. Yet the higher quality of this year’s crop means it is likely growers can expect a higher price than last year.
All things considered, I expect the price will be in the range of 35 cents to 45 cents per inshell pound for the 2023 crop, a modest increase from the 32 cents per inshell pound for last year’s crop (see Chart 7). If this forecast price range is correct, walnut profitability will improve, but with most growers still struggling to break even (see Chart 8).
The higher quality of this year’s crop means it is likely growers can expect a higher price than last year.
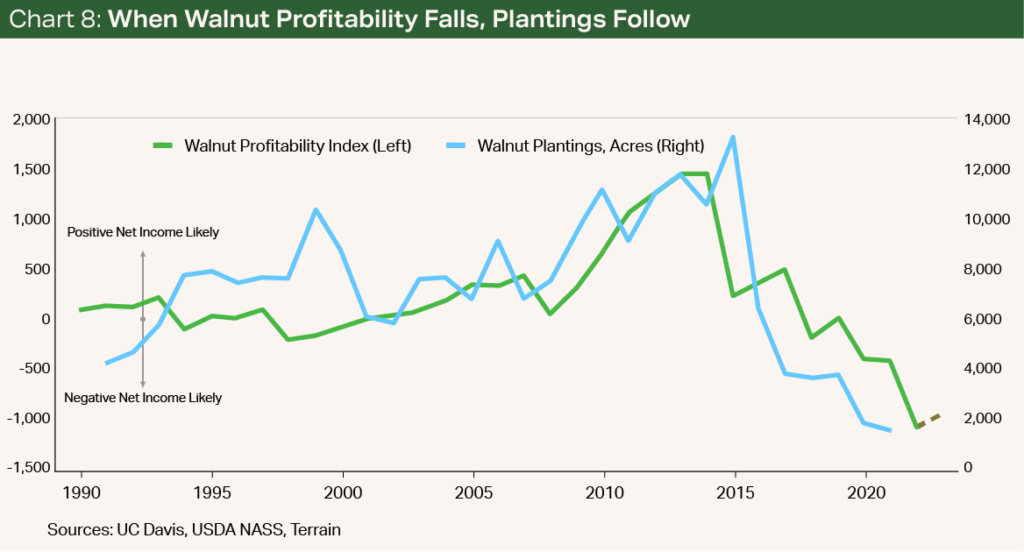
In the longer term, it is likely that California walnut production will decline from its current peak given the fall in bearing acres.
This will be reduced further by the decline in new plantings, which unsurprisingly fell shortly after the drop in profitability. Assuming these trends continue, it is likely that walnut production in the state will come in near 1.4 billion to 1.5 billion pounds going forward.
There is no doubt that there are many structural issues facing the California walnut market. These unique challenges, combined with headwinds facing agriculture in the state more broadly, are likely to flatten production and pricing going forward. Nevertheless, it is likely that 2022 was the perfect storm that marks the nadir in the market for most growers.
It is likely that 2022 was the perfect storm that marks the nadir in the market for most growers.
Works Cited
1 USDA National Agricultural Statistics Service, “2023 California Walnut Objective Measurement Report,” October 4, 2023, https://www.nass.usda.gov/Statistics_by_State/California/Publications...pdf.
2 Ellen Byron, “Is Baking’s Pandemic Popularity Just a Flash in the Pan?” Wall Street Journal, May 25, 2021,
https://www.wsj.com/articles/is-bakings-pandemic-popularity...
3 USDA Foreign Agricultural Service, PSD (Production, Supply and Distribution) database, https://apps.fas.usda.gov/psdonline/app/index.html#/app/home.
4 World Bank, World Development Indicators, https://data.worldbank.org/indicator/SP.POP.TOTL.
5 USDA Foreign Agricultural Service, “Australia: Tree Nuts Annual,” October 19, 2020,
https://apps.fas.usda.gov/newgainapi/api/Report/DownloadReportByFileName...
6 USDA Foreign Agricultural Service, “European Union: Tree Nuts Annual,” September 29, 2021,
https://apps.fas.usda.gov/newgainapi/api/Report/DownloadReportByFileName...;
and California Walnut Commission, “Walnuts – A Christmas Tradition,” https://www.californiawalnuts.co.uk/blog/walnuts-a-christmas-tradition/.
7 United Nations, Comtrade, https://comtradeplus.un.org/.
8 Daniel Sumner, Tristan Hanon and William Matthews, “Implication of Trade Policy Turmoil for Perennial Crops,” Choices, 2019,
https://www.choicesmagazine.org/choices-magazine/theme-articles/...
9 USDA National Agricultural Statistics Service, “2021 California Walnut Nursery Sales Report,” July 20, 2022,
https://www.nass.usda.gov/Statistics_by_State/California/Publications/...pdf.
10 California Walnut Board, “December 2023 Shipments,” January 10, 2024, https://walnuts.wpenginepowered.com/...pdf.
Terrain content is an exclusive offering of American AgCredit, Farm Credit Services of America and Frontier Farm Credit.