Outlook • June 9, 2025
The Moderation Movement Part 1
This article appears as the Trending Topic section of Terrain's Summer 2025 issue of Winescape, a report series that provides in-depth analysis of the wine and grape markets.
Following nearly three decades of uninterrupted growth, alcohol consumption in the U.S. looks to be declining. The demographics of the alcohol consumer also are evolving. Both trends have important repercussions for the wine industry.
In this piece, the first in a two-part series, I frame the problem by assessing the evidence that alcohol consumption is declining and by examining changes in demographic-specific alcohol use rates and the composition of the alcohol consumer base.
In part two in the upcoming Fall 2025 issue of Winescape, I assess the range of factors that are potentially driving the decline in alcohol consumption and whether they are likely to be temporary or longer lasting phenomena.
Evidence is Mounting that Alcohol Consumption is Declining
U.S. alcohol consumption grew steadily from the mid-1990s to the early 2020s. However, per capita consumption began to flatten in the late 2000s, though total consumption continued to grow slowly due to an expanding drinking-age population.
That’s according to the National Institute for Alcohol Abuse and Alcoholism (NIAAA), the most definitive source of statistics on U.S. alcohol consumption. As part of its core mission, NIAAA constructs annual estimates of total and per capita consumption based on a comprehensive review of relevant information sources. It relies on retail sales data, whenever possible, as they are the most accurate consumption indicator. It also incorporates other sources of information such as shipment and production data when sales figures are missing or deemed insufficient.
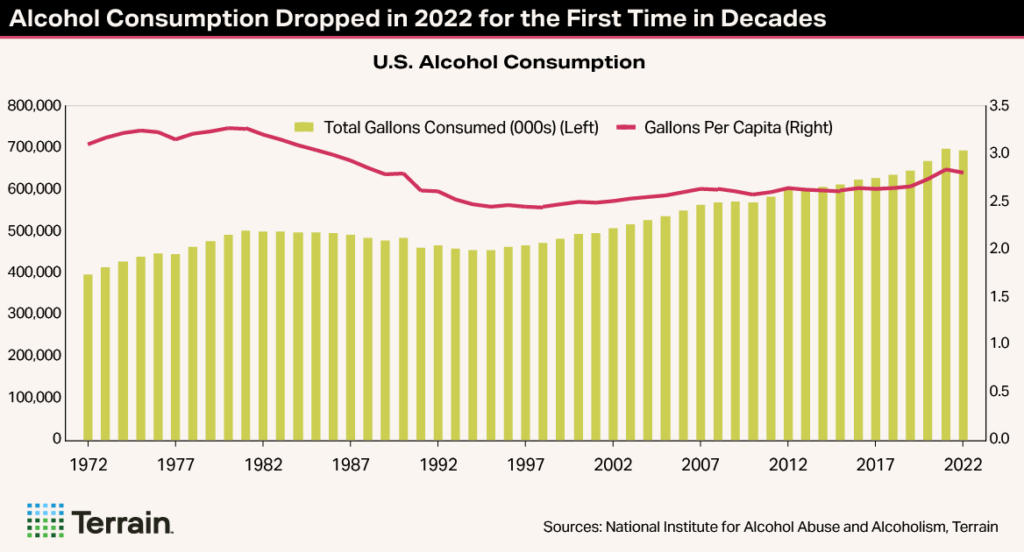

Consumption surged during the pandemic then fell in 2022 in both per capita and absolute terms, though both metrics were still tracking ahead of their pre-pandemic levels. This represents only the second annual decline since 1994.
The NIAAA data are only available through 2022; therefore, they do not yet provide conclusive evidence that alcohol consumption has continued to decline. Unfortunately, data for 2023 have been delayed due to restructuring within the Department of Health and Human Services and there is no timetable for their release. However, the following relevant information sources suggest the downward trend in alcohol consumption has continued, and likely accelerated, since then.
1. Alcohol Sales Data
More-timely data is available for alcohol sales. There is no single comprehensive source of alcohol sales data; however, the sources with the broadest coverage, including NIQ (off-premise retail sales) and SipSource (distributor depletions), indicate that sales volumes have declined across the beer, wine and spirits categories in 2023 and 2024, and that slump has continued into 2025. While these data are not comprehensive, I am not aware of any source of sales data that implies that alcohol sales volumes grew over the past two years.
IWSR compiles retail sales data from multiple data providers to estimate total annual beverage alcohol sales. They indicate that sales volumes fell by 2.6% in 2023. The preliminary estimate for 2024 suggests that there has been no progress since then.
IWSR data also suggest that declining alcohol consumption is a global phenomenon. Global alcohol sales fell by 1% in 2023, the first decline in 30 years. They fell by an additional 1% in 2024.
2. Alcohol Tax Data
Alcohol tax statistics are more comprehensive and reasonably accurate due to strict regulations governing alcohol sales. However, taxes are generally paid when alcohol enters the U.S. or is shipped by domestic producers to market, rather than when it is sold to consumers. Thus, changes in inventory levels at distributors and retailers can cause retail sales and tax-paid shipments to deviate over shorter time frames.
Data from BW166, which estimates per capita and total alcohol servings based on tax data, depict a similar trend to the NIAAA data of flat per capita consumption coupled with slowly growing total consumption prior to the pandemic. These data show a greater surge during the pandemic followed by a steeper subsequent decline. Moreover, they indicate that consumption has fallen to below its pre-pandemic level.
These data add to the evidence that alcohol consumption is declining, though they may overstate the magnitude of the decline due to inventory-related issues.
Surveys Also Suggest that Fewer Americans are Drinking
Surveys do not attempt to estimate aggregate alcohol consumption, but they can provide valuable insight into trends in alcohol use. Several prominent surveys indicate that fewer Americans are drinking than in the past. For example, the Gallup Poll shows that the percentage of Americans “who have occasion to use alcoholic beverages” fell to 58% in 2024, the lowest figure in at least 25 years, though there has been considerable volatility from year to year.
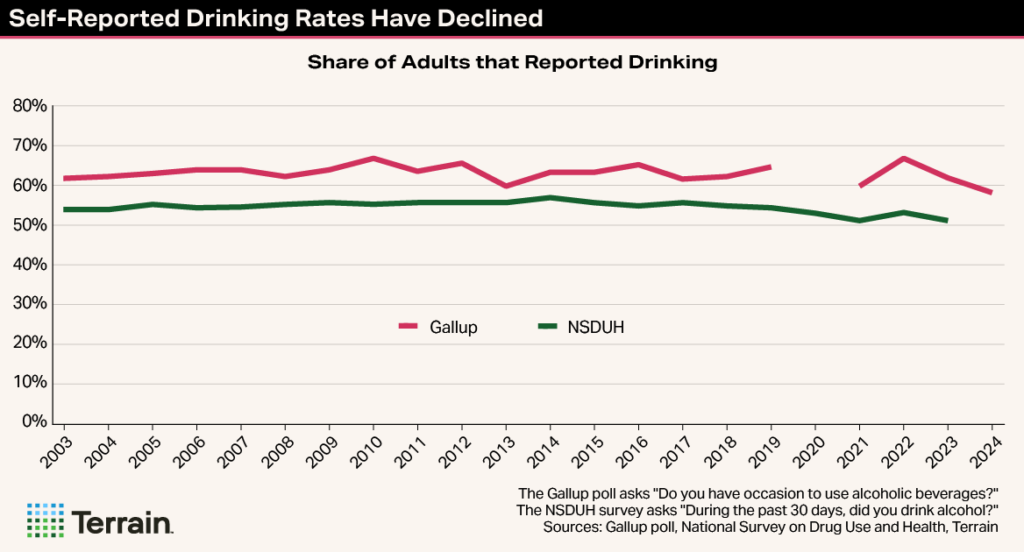

Similarly, the National Survey on Drug Use and Health (NSDUH), the largest and most respected alcohol use survey, suggests that fewer Americans are drinking. It surveys nearly 70,000 people annually. The percentage of legal drinking age adults who reported consuming alcohol in the past 30 days began decreasing in the mid-2010s and the pace of decline has accelerated since 2019. It now stands at 52%, a three-percentage point drop from its pre-pandemic level.
The NSDUH survey also extrapolates the results to the entire U.S. population, so it is possible to derive an estimate of the total number of alcohol consumers, which should be correlated with alcohol consumption. The number of past-month drinkers, which approximates the number of regular alcohol consumers, plateaued during the mid- to-late 2010s, then declined by 4.6 million between 2019 and 2023.
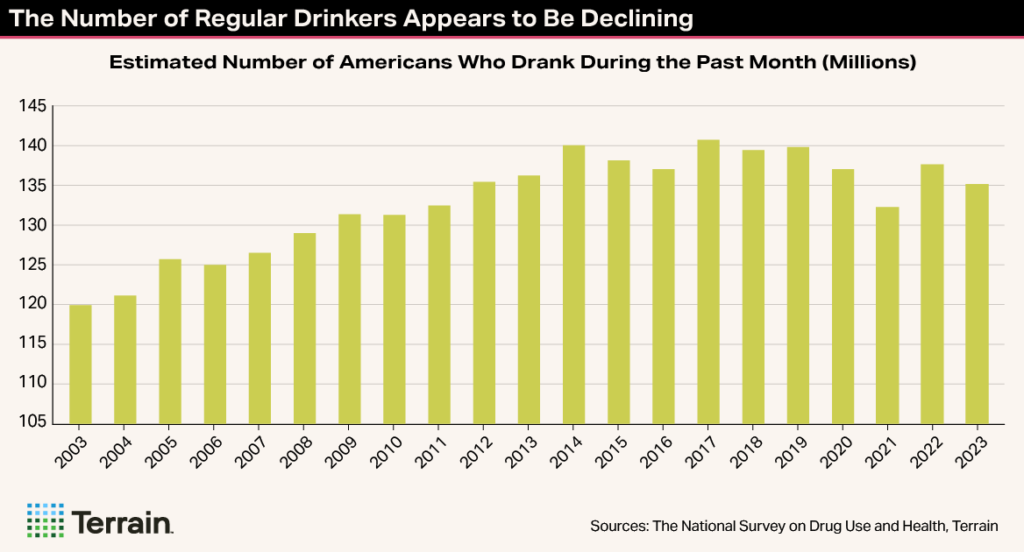

The survey evidence is consistent with the contention that alcohol consumption is declining. However, several cautions are in order when interpreting survey results.
First, responses do not always mirror real-world behavior, particularly in the case of alcohol use, which tends to be under-reported. Even so, there is no evidence that under-reporting has increased over time, though this is certainly possible.
Second, there can be issues of comparability over time. NSDUH temporarily reduced its sample size and switched from in-person to online interviews in 2020 due to the pandemic and has used a combination of the two since. Therefore, the pre-2020 and post-2020 results are not strictly comparable. Even so, the question pertaining to past month drinking has not been altered, so the results should provide a reasonably accurate depiction of trends in alcohol use.
All Signs Are Pointing in the Same Direction
While the evidence is still circumstantial, all signs are pointing in the same direction: following decades of steady growth, alcohol consumption now appears to be declining, albeit versus an elevated level during the pandemic. The picture will become clearer when the NIAAA releases updated figures.
The key question is: Will alcohol consumption continue to decline going forward? The drivers of the moderation movement are difficult to disentangle, and I will address this topic in depth in the fall issue of Winescape.
To set the stage for this, it is first important to understand who is drinking less, as this can provide clues as to which factors are most significant. The NSDUH survey collects detailed demographic information from respondents, and its sample size is large enough to produce reasonably reliable estimates for population subgroups.
An examination of the NSDUH data suggests that the decline in alcohol use has not been even; rather, it has been concentrated among specific demographic groups.
Who is Drinking Less?
While the NSDUH data does not directly measure changes in alcohol consumption, it can provide insight into how drinking rates have changed for various demographic groups over time. Given the survey limitations discussed previously, I view these to be directionally accurate estimates of differences across groups as opposed to precise measures of change over time.
The NSDUH survey indicates that the decline in self-reported alcohol use has been most pronounced for three broad demographic groups: young adults, men, and Non-Hispanic white people.
Gen Z is Only Part of the Story
The popular press has sensationalized the point that Gen Z (aged 11 to 26 in 2023) is showing less interest in drinking than prior generations when they were the same age. While this does appear to be true, Gen Z is not the sole factor: self-reported alcohol use has fallen for all but the 65+ age cohort over the past 10 years.
Looking at the past 30-day drinking rates disaggregated by age shows that the decline in alcohol use has been most pronounced for the youngest age cohorts, and that the magnitude of the drop diminishes progressively with each successive age band. This suggests that changing alcohol use patterns have a generational component.
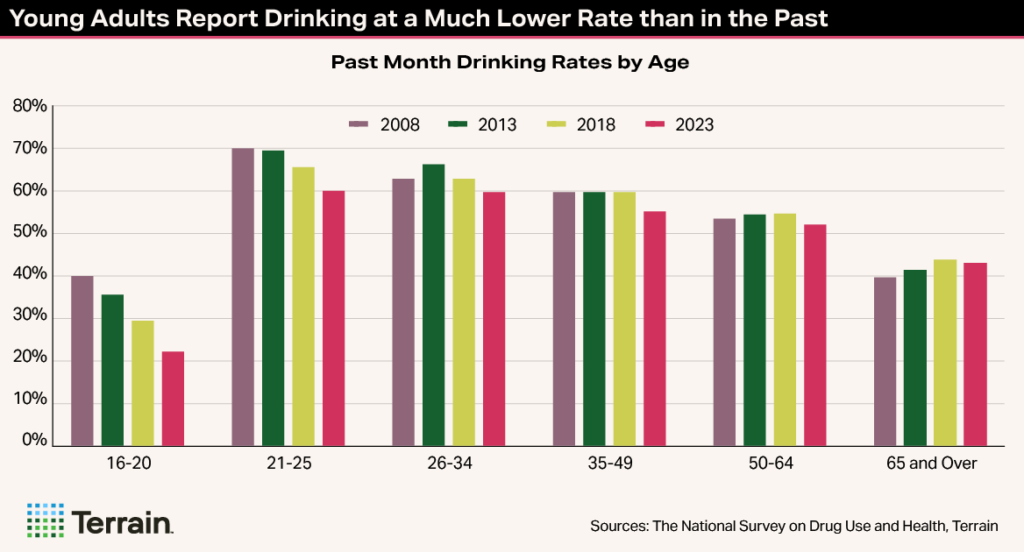

Past-month drinking rates have declined by 14 percentage points for 16- to 20-year-olds over the past decade and by 10 percentage points for 21- to 24-year-olds. These age bands were occupied by Millennials 10 years ago – and are now comprised of Zoomers (Gen Z). Thus, a smaller share of legal drinking age (LDA) and under-age Zoomers report drinking than the Millennials did when they were of the same age. So, Gen Z clearly is leading the abstinence trend.
If it continues to drink at significantly lower rates than prior generations as it ages, Gen Z will exert increasing downward pressure on alcohol consumption.
Nonetheless, the decline in alcohol use in this age range began well before the range was occupied by Gen Z. Underage drinking has been falling steadily for decades and the decrease in drinking rates for 21- to 24-year-olds began when it was comprised of Millennials. Moreover, there have been noticeable drops in alcohol use for the 26-34 and 35-49 age cohorts over the last decade, and drinking rates for 50- to 64-year-olds also have slipped over the past five years.
Because of its youth, Gen Z still represents a relatively small share of the drinking age population, so it has not yet had a substantial impact on overall drinking rates. However, if it continues to drink at significantly lower rates than prior generations as it ages, Gen Z will exert increasing downward pressure on alcohol consumption.
Conversely, alcohol use by mature adults aged 50 to 64 has been steadier, though it did begin to decline as Gen X entered this age range, and survey participants who are 65 and older report slightly higher alcohol use rates than they did 10 years ago. The increase in drinking rates for older Americans coincides with the Boomers' ascent into this age category beginning in 2011.
Taken together, the age-specific data indicate that each successive generation is drinking less than the prior, though the drop appears to be particularly pronounced for Gen Z.
Men and Non-Hispanic White Consumers Are Less Likely to Drink than in the Past
The reduction in reported drinking rates has been more severe for men than women, though men are still more likely to be drinkers. The share of men that reported consuming alcohol in the past month has declined by seven percentage points over the last 10 years – which compares to just a two-point drop for women.
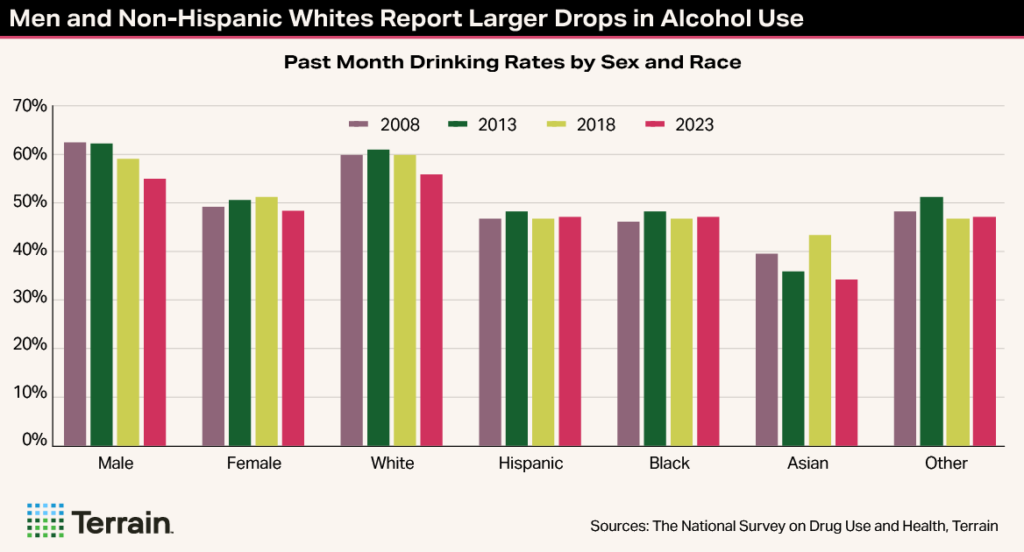

In terms of race, Non-Hispanic white people are more likely to drink than are other racial/ethnic categories, but alcohol use rates are beginning to converge because drinking rates among white people have declined while those for Black and Hispanic Americans have held steady. The share of Asian Americans who are drinking also looks to be declining, though the figures are more volatile because sample sizes are smaller.
Fewer Young Men Are Drinking, but More Hispanic and Black Women Are
More nuanced insights into alcohol use trends can be derived by cross tabulating these data. I indexed the past-30-day drinking rates in 2023 for the 18+ population to their 2013 levels for each group. Values below 100 indicate that drinking rates have declined over the past 10 years, while those above 100 signify increases. Note that this level of disaggregation also reduces sample sizes and increases margins of error, particularly for the smaller population subgroups.
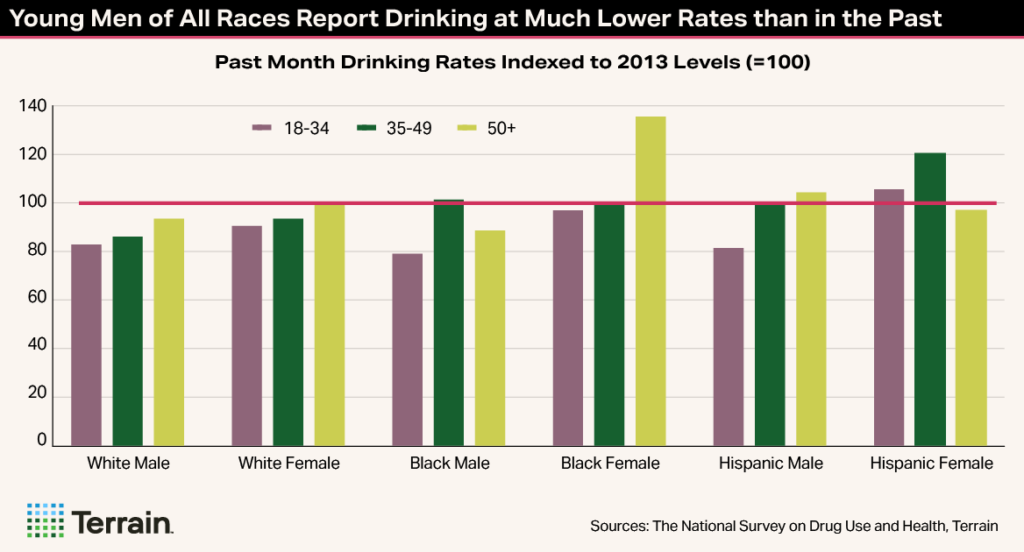

The most important finding from this analysis is that adult men under the age of 35, of all races, report drinking at much lower rates compared to those of the same age 10 years ago. Past-month drinking rates for young men fell from 70% in 2013 to 57% in 2023, while those for young women fell only modestly from 59% to 56%.
A final key takeaway is that Black and Hispanic women are reporting higher drinking rates than in the past. This is primarily due to surging alcohol use by Black women over the age of 49 and Hispanic women aged 35 to 49, though margins of error are larger for these small demographic segments.
The Composition of Alcohol Consumers Is Evolving
The shifts in demographic-specific drinking rates, combined with differential rates of population growth, are altering the alcohol market.
Some demographic groups have increased their weight in the alcohol consumer base while others have declined.
While the estimated total number of drinkers in 2023 was roughly the same as it was 10 years earlier, some demographic groups have increased their weight in the alcohol consumer base while others have declined.
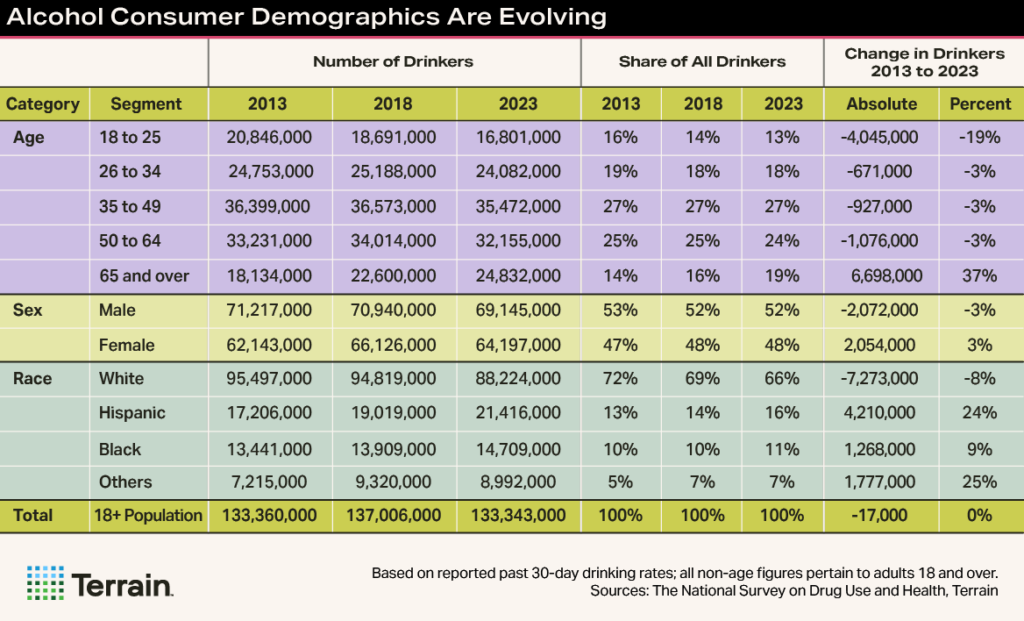

Most importantly, multicultural consumers now comprise 34% of regular alcohol drinkers versus 28% a decade ago. This represents an absolute increase of 7.3 million, which is juxtaposed by a similar drop in the number of Non-Hispanic white drinkers. The increase in the number of multicultural alcohol consumers has been driven mainly by faster population growth, while the decline in white alcohol consumers is a product of declining drinking rates coupled with stagnant population growth. (More on global demographic changes can be found in Terrain’s report series, The Big Shrink).
The number of alcohol consumers over the age of 65 has also grown, by nearly 7 million, as the U.S. population has aged and alcohol use rates have ticked up slightly for older adults. Older Americans now represent 19% of alcohol consumers, up from 14% a decade earlier. Conversely, the number of young adults between the ages of 18 and 25 has declined by more than 4 million.
Digging deeper into the data, the picture becomes more nuanced. There are several specific pockets of growth. For example, there are nearly 2.5 million more Hispanic women drinkers spread across the three age groups, and they now comprise 7% of the total drinking population. Other growth segments include Hispanic men over the age of 34 (2.2 million) and Black women 50 and over (1.1 million).
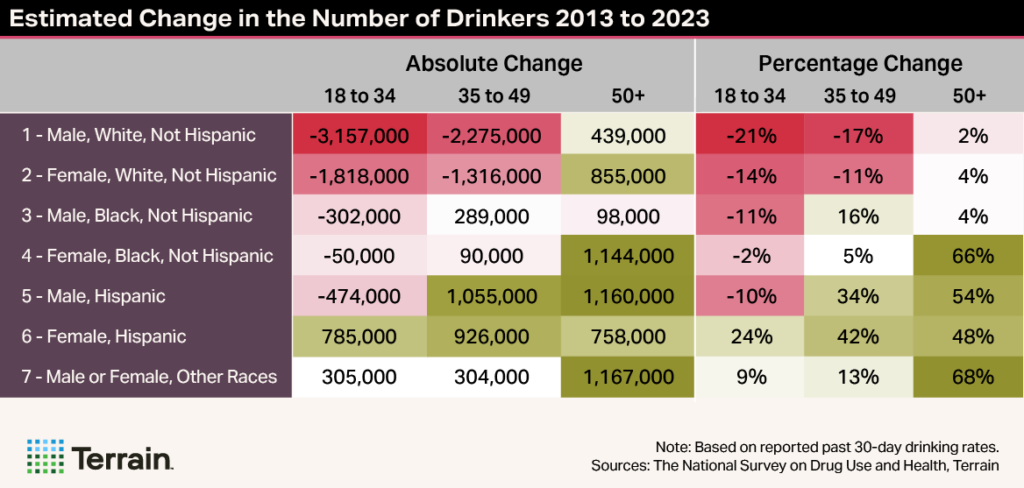

Conversely, the number of alcohol consumers who are white men under the age of 50 declined by 5.4 million, while the number of white women in this age range fell by 3.1 million.
A final point to note is that the demographic-specific estimates of monthly alcohol consumers are not measures of total alcohol consumption because the frequency of drinking and number of drinks consumed per drinking occasion vary across groups. However, it is possible to derive a rough approximation of total drinks consumed by combining the responses to the questions pertaining to these topics in the NSDUH survey.
These figures suggest that men who drink alcoholic beverages consume substantially more than women drinkers and that white drinkers consume moderately more than multicultural alcohol consumers. Thus, the share of total alcohol consumption attributable to demographic segments such as Hispanic and Black women is lower than their share of total alcohol consumers.
Key Takeaways
The evidence is mounting that alcohol consumption has begun to decline, though the trend is still not well established due to data lags and pandemic-related distortion. This is obviously a troubling development for wine producers: if it continues, wine will need to take market share to avoid declining sales volumes.
Survey evidence suggests that Gen Z is part of the trend, but self-reported drinking rates have fallen for all but the 65+ age category in recent years, though less forcefully. Past-month drinking rates have also declined more for men than women—young men in particular—as well as for Non-Hispanic white people. Conversely, Hispanic and Black women appear to be drinking at higher rates than in the past.
These patterns provide clues as to why alcohol consumption is declining and whether it will continue to do so, a point that I will return to in part two of this series in the Fall 2025 Winescape issue.
It is vitally important for wine producers to understand these shifts because they highlight potential threats as well as areas of opportunity.
Variation in changes in demographic-specific drinking rates coupled with differential rates of population growth also are altering the demographics of alcohol consumers. For one, the number of younger drinkers is shrinking while the number of older drinkers is growing rapidly. Alcohol consumers are also becoming more diverse. The number of multicultural drinkers is climbing, particularly among Hispanic consumers, while the number of white alcohol users is declining.
The changing demography of alcohol consumers represents a challenge for wine, as it has traditionally under-indexed with multicultural consumers. This trend may be part of the explanation for wine’s declining market share.
It is vitally important for wine producers to understand these shifts because they highlight potential threats as well as areas of opportunity. Specifically, it is crucial for the wine industry to find ways to connect more effectively with multicultural alcohol consumers, as they represent an expanding share of its potential audience.
See part two of this series in the next edition of Winescape for an in-depth analysis of the factors that are driving the moderation movement, whether it is likely to persist, and its implications for the wine market.
To subscribe to future Winescape reports, visit winescape.com.
Terrain content is an exclusive offering of AgCountry Farm Credit Services,
American AgCredit, Farm Credit Services of America and Frontier Farm Credit.