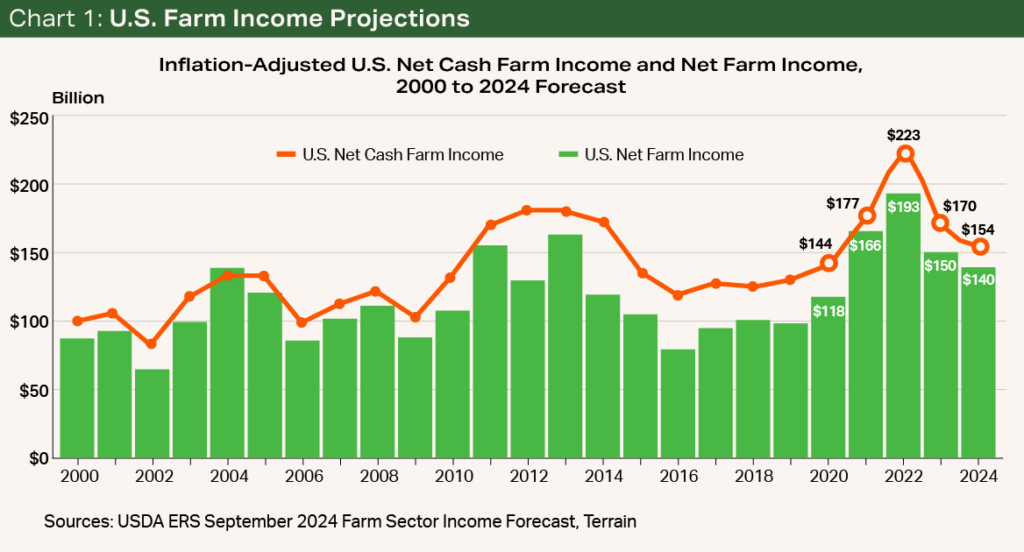
Everyone in or close to production agriculture knows that nearly all sectors have seen profitability fade in recent years, as U.S. net cash farm income has experienced the steepest two-year decline in history. Recent farm sector income projections by the USDA’s Economic Research Service show how dramatic that loss in profitability has been and where rural economies have experienced the deepest cuts.
The flagship measurement of the overall health of the farm economy is the USDA’s forecast for net farm income, which measures the difference between total gross farm income and total production expenses and is a broad measure of aggregate U.S. farm profitability.1
Specifically, the USDA’s September 2024 Farm Sector Income Forecast revealed:
- U.S. net farm income is forecast at $140 billion in 2024, down 7% or $10 billion from 2023 when adjusted for inflation.
- U.S. net cash farm income, which considers the year in which farm sales of crop or livestock products occur, is forecast at $154 billion in 2024, down $16 billion or 10% when adjusted for inflation.
- If realized, the $69 billion decline in inflation-adjusted U.S. net cash farm income over the last two years would be the largest on record.
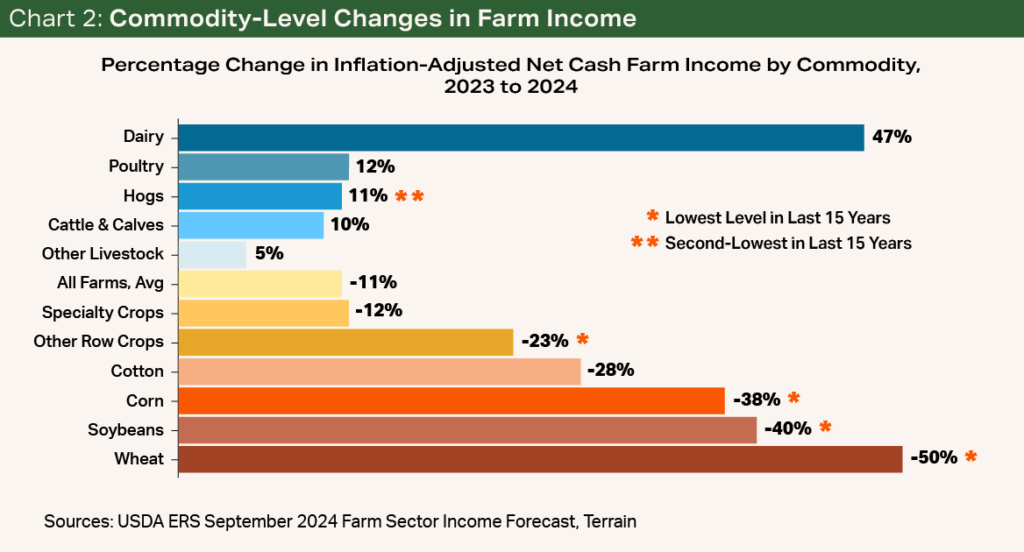
- Inflation-adjusted net cash farm income for row crops such as wheat, corn, soybeans and cotton, as well as specialty crops, is projected to fall sharply in 2024, with many experiencing the lowest income levels in more than a decade.
- Cattle, dairy and poultry operations are projected to see higher net cash farm income in 2024. While net cash farm income for hog operations is projected to improve from last year, 2024’s net cash farm income is the second lowest in over a decade when adjusted for inflation.

Buried beneath the headlines in the September Farm Sector Income Forecast were the first state-level measures of gross farm income, production expenses and net farm income for 2023. Last year was the first year of the economic downturn that has now resulted in tighter margins and prices below breakeven for many farmers in the U.S. The USDA’s new projections provide insight into the regional health of the farm economy, and aid lawmakers and agricultural industry stakeholders in understanding the economic headwinds facing farmers and ranchers across the U.S. as they guide important farm policy decisions.
State-Level Farm Income Forecasts for 2023
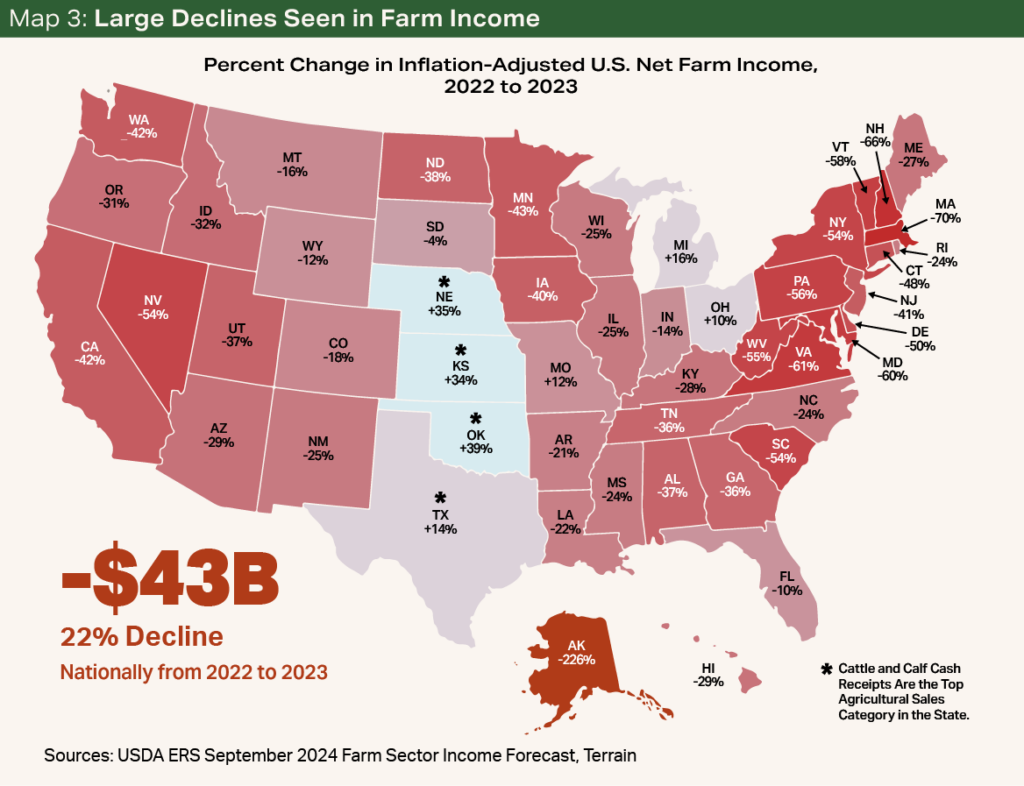
The USDA projected inflation-adjusted U.S. gross farm income for 2023 at $624 billion, down $33 billion or 5% from the 2022 estimate. Forty-four states saw lower inflation-adjusted gross farm income in 2023 than the previous year. Iowa farmers saw the steepest decline in gross farm income, down $5.6 billion or 11% from 2022 when adjusted for inflation. Gross farm income was the highest in California at nearly $67 billion, despite being down $3 billion or 4% from 2022’s inflation-adjusted measure.
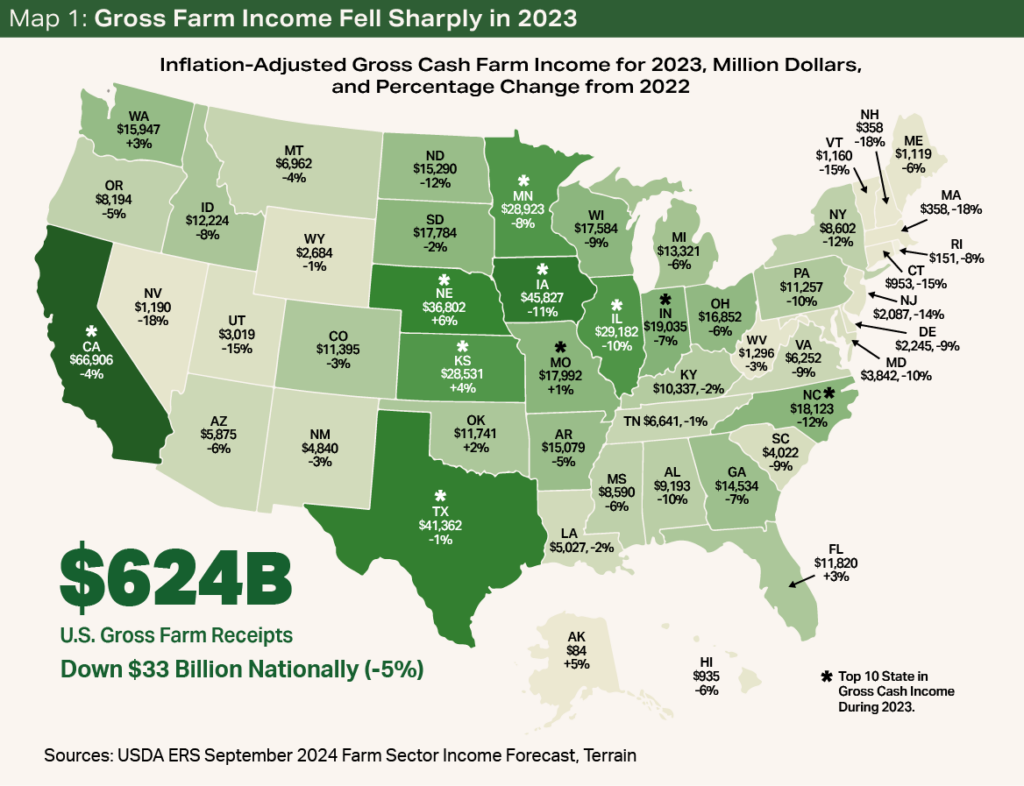

In nominal terms, U.S. farm production expenses were record high in 2023 at $462 billion. When adjusted for inflation, production expenses in 2023 totaled $474 billion and were the fourth highest on record.
Given that California is the nation’s largest farm economy, it is no surprise that the cost of producing the hundreds of various crops, specialty crops and livestock products grown in the state would be the highest in the country. Importantly, California farm families experienced the highest rise in input costs in the country. Totaling $54 billion in 2023, inflation-adjusted farm production expenses in California climbed 13% from the previous year. On average, inflation-adjusted farm production expenses went up by more than $100,000 per farm in California in just one year.
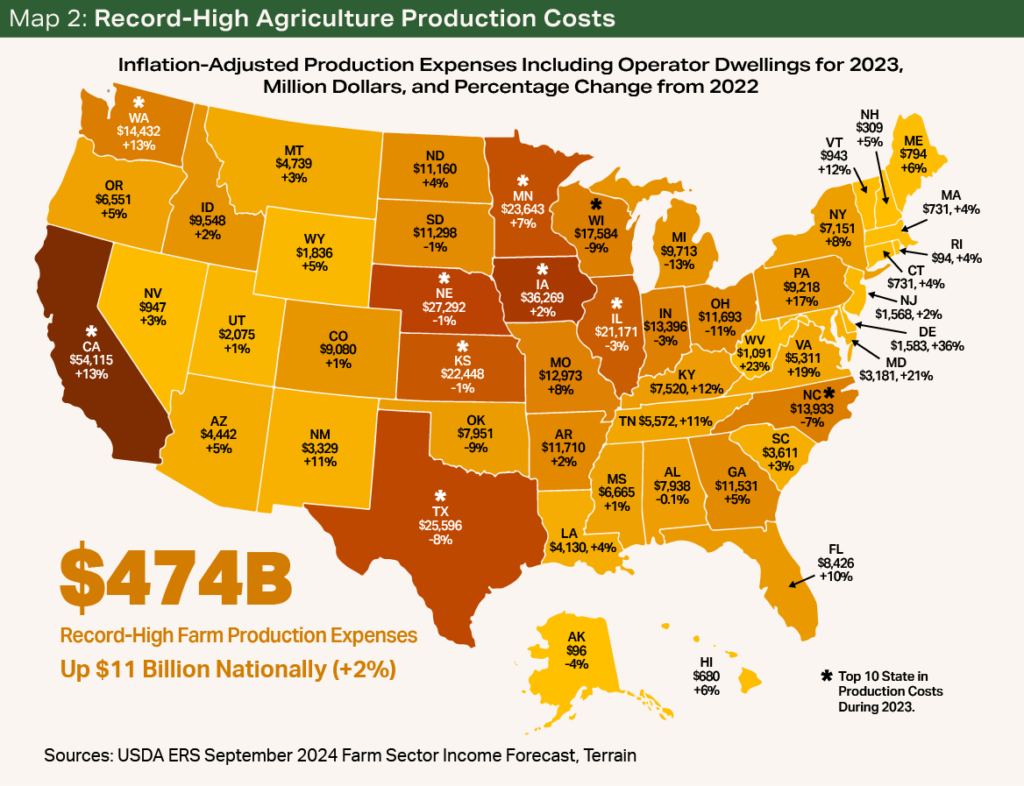

Comparing the difference between farm income and production expenses reveals a sharp $43 billion, or 22%, decline in inflation-adjusted U.S. net farm income in 2023, now projected at $150 billion. If realized, the year-over-year decline in inflation-adjusted net farm income would be the fourth largest on record.
All but six states saw a decline in inflation-adjusted net farm income in 2023. States with increases in net farm income in 2023 saw higher cash receipts in the cattle sector that more than offset declines in the receipts from the sales of hogs or crops such as corn, soybeans and wheat.
Among the states experiencing a decline in inflation-adjusted net farm income, California led the pack with a $9 billion, or 42%, decline in farm profitability. The decline in California farm profitability can be partially attributed to low almond and walnut prices combined with record-high labor costs across all farm operation types.
Other states with large declines in inflation-adjusted farm profitability measures include Iowa (down $6 billion), Minnesota (down $4 billion) and Illinois (down nearly $3 billion) — all large corn-, soybean- or hog-producing states. Given the USDA’s projection for lower U.S. net cash farm income in 2024 for major row crops, it is likely that state-level farm income estimates — especially in the corn and cotton belts — will further decline in 2024.

Conclusion
The USDA’s September 2024 Farm Sector Income Forecast confirmed that margins have tightened in nearly every region of the country and across most major row crop and specialty crop categories. In some cases, prices ultimately received by farmers may be below their breakeven.
Profitability may be improving for livestock and dairy operations (Strong Beef Demand Is A Win For Dairy Farmers), but other challenges such as the high cost for beef and dairy female replacements and labor limit the ability of these farm families to capitalize on the improved economic outlook through expansion. Higher income projections for dairy farmers and poultry producers remain uncertain given the ongoing outbreak of highly pathogenic avian influenza impacting dairy and egg producers.

While economic conditions have changed significantly for many producers, the Federal Reserve’s recent rate cut and the outlook for lower interest rates over the next 12 months present opportunities for farmers to potentially lower production costs and increase working capital.
It's important for producers to consider opportunities in commodity marketing, risk management, crop insurance, and USDA commodity programs even when margins are tight or unprofitable. Terrain experts are available alongside Farm Credit lenders to provide producers with outlooks and insights important for making informed business decisions as they implement risk management and commodity marketing strategies.
1Gross farm income includes income from the sales of crops and livestock, direct government farm program payments such as those from conservation or countercyclical payment programs, farm-related income streams such as wildlife recreation, consumption of farm-produced products, and inventory adjustments. Total production expenses include all production expenses related to the production of crops and livestock including operator dwellings.
Terrain content is an exclusive offering of AgCountry Farm Credit Services,
American AgCredit, Farm Credit Services of America and Frontier Farm Credit.