Report Snapshot
Situation
Many worry that electrified vehicles, fuel economy standards, and improving battery technology will make the internal combustion engine (ICE) obsolete, illegal, or both, with wildly varying estimates of the timeline. Many of these forecasts overlook the growing age of America’s light duty vehicle fleet and the implications for future liquid fuel demand.
Finding
The transition to electrification will be slower than anticipated, and as electrification includes plug-in electric hybrid vehicles (PHEVs), gasoline demand will still exist for an electrified market.
Impact
Ethanol continues to consume 35% of US corn production, and ethanol consumption depends on gasoline demand. Domestic ethanol demand will eventually decline, absent other changes in policy or automaker behavior, but will stretch much longer than is often anticipated, avoiding devastating destruction to corn prices or farmland prices.
Vehicular Electrification


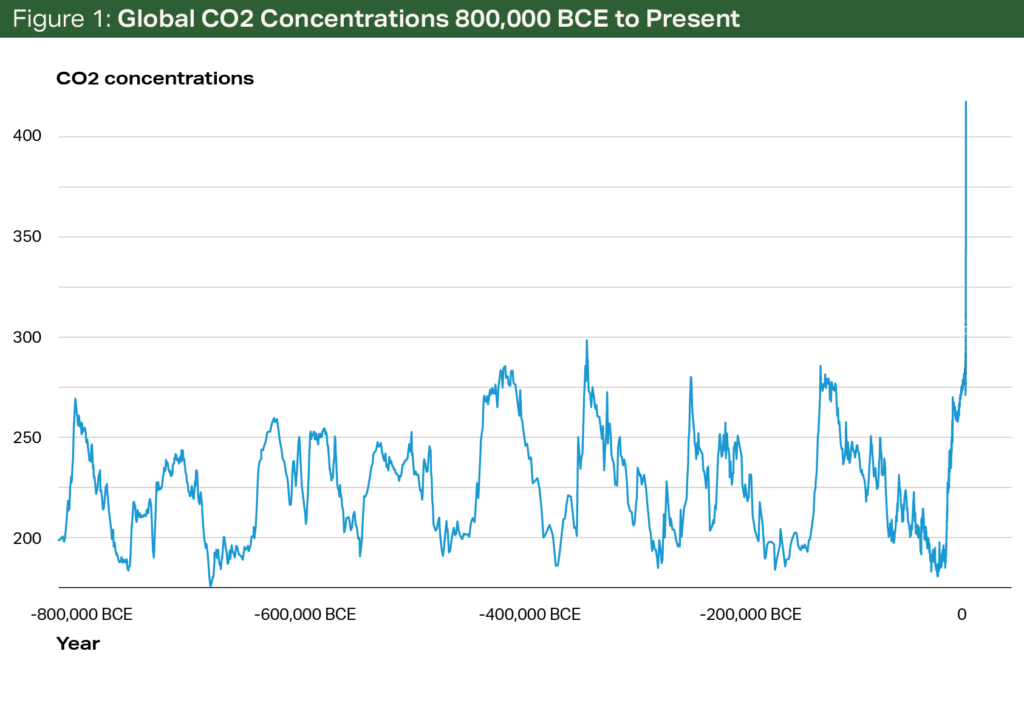
The driving force for governments toward vehicular electrification is the desire to curb global carbon emissions and atmospheric concentrations. Once fleets are electrified, governments and markets can alter the ultimate sources of transportation energy without having to modify the vehicle fleet again. Areas that are solar-rich could more intensely utilize solar electricity without requiring any differences in the fleet from an area that is rich in hydro or nuclear power. Even fossil fuels, such as natural gas, coal or petroleum could be used.
The driving force for governments toward vehicular electrification is the desire to curb global carbon emissions and atmospheric concentrations. Once fleets are electrified, governments and markets can alter the ultimate sources of transportation energy without having to modify the vehicle fleet again.
There are other alternatives to electrification for the post-liquid fuels era. Hydrogen fuel cell vehicles have been sold by multiple manufacturers. However, while hydrogen is the most abundant element in the universe, it requires significant energy to manufacture in its pure form and likewise requires a large infrastructure investment of production, storage, transportation and fueling facilities to make it useful as a fuel.
Battery-electric vehicles (BEVs) likewise require the construction of charging infrastructure for mass adoption to occur, but the backbone of electrical generation and transmission exists and is well understood. Wide-scale adoption of BEVs require upgrades to existing infrastructure instead of construction of an entirely new infrastructure.
The Realities of Electrical Vehicle Market Share
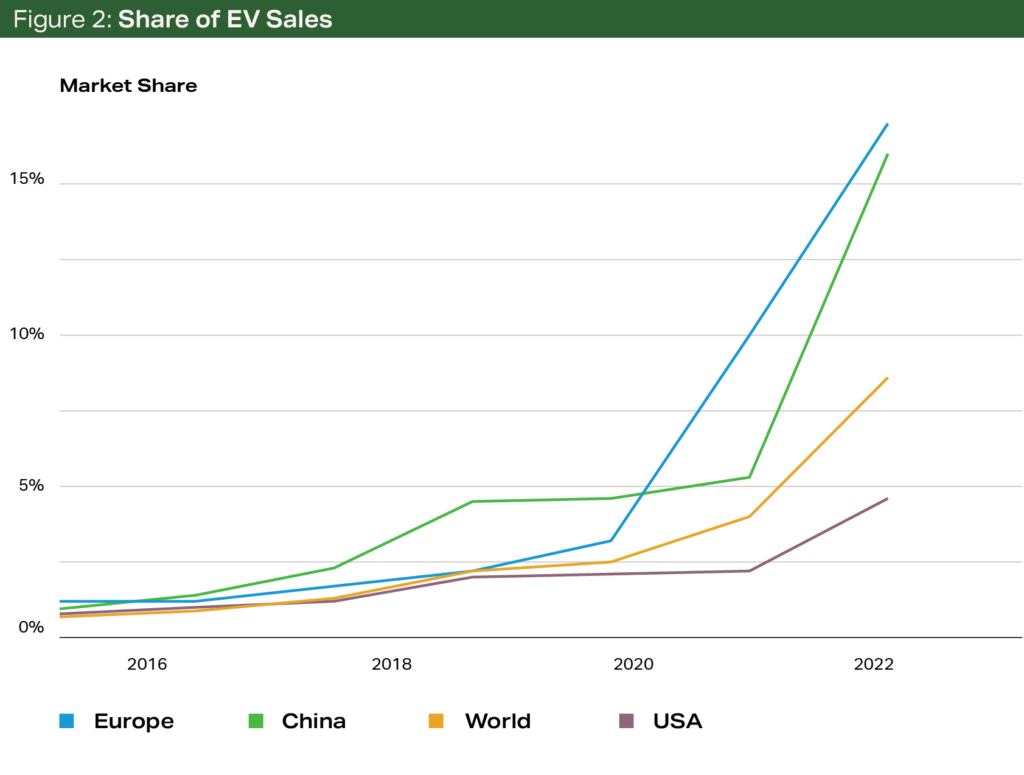
Over the past few years, many governments and automakers have announced their movement away from internal combustion engine (ICE) vehicles.
- Mercedes-Benz announced that all of their light duty vehicles would be electric by 2030.
- Audi announced that they would phase out ICEs by 2033.
- General Motors announced an end to all light duty ICEs by 2035.
More recently, the California Air Resources Board (CARB), in its Advanced Clean Car II rule, mandated that by 2035, all light duty vehicles—passenger cars and light trucks—sold in California must be Zero Emission Vehicles (ZEV). Thirteen other states and the District of Columbia follow CARB standards. In total, these rules will apply to states that sell 40% of passenger cars.
In all of these cases, the headline announcement reads much worse for renewable fuels than the fine print.
In the case of Mercedes-Benz for example, they caveat their claim with “where market conditions permit.” When announcing a move to electrification, Mazda considers plug-in hybrid electric vehicles (PHEVs) to be ‘electrified.’ In California’s Advanced Clean Car II rule, up to 20% of major manufacturers’ ZEVs can be PHEVs1. For smaller manufacturers, all of their sales can be made up of ZEV-compliant PHEVs.


These details might seem quibbles, but they are important in understanding the true impact of vehicular electrification on liquid fuels demand. Nearly all of the announcements that portend the death of gasoline in fact continue to permit gasoline consumption.
The Role of Older Vehicles
The most important consideration in liquid fuel demand isn’t even related to the headlines or state rules; it is the speed with which newer vehicles, electric vehicles especially, displace older vehicles in the marketplace.


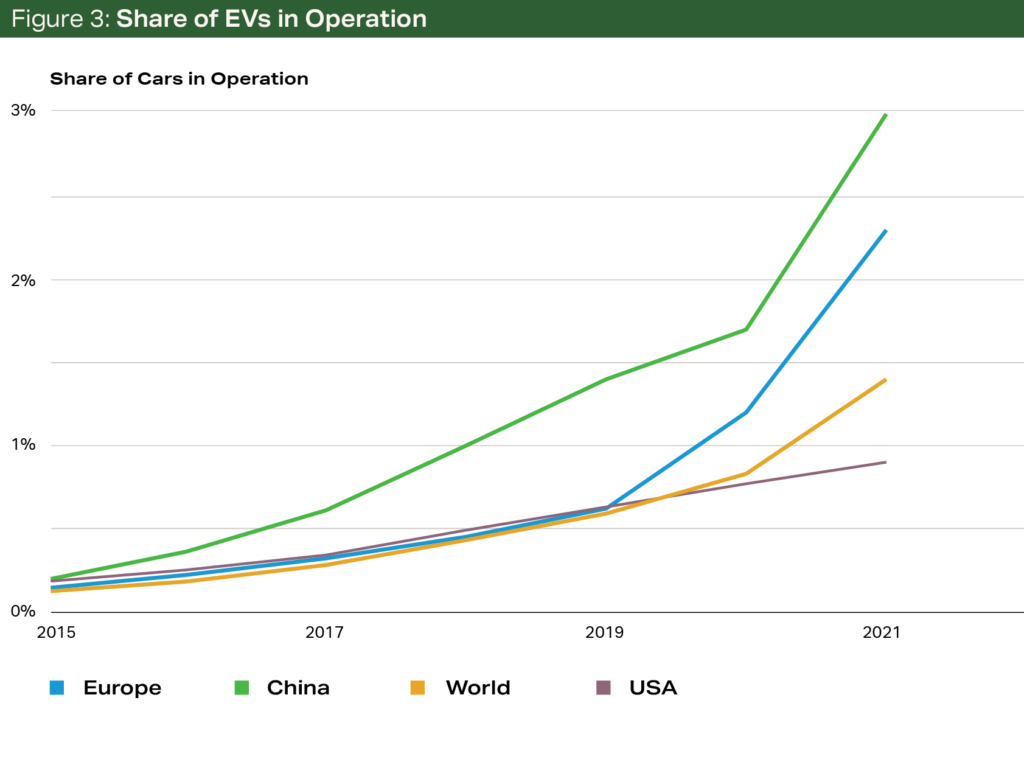
In 2002, the average age of light duty vehicles2 registered in the U.S. was 9.6 years. It has steadily increased to reach 12.2 years in 2022. For passenger cars, the current age is even higher: 13.1 years. Based on S&P Global Mobility estimates, the aging of the fleet is not leveling off. The age continues to increase, and it appears to be increasing at an increasing rate. Hill, et al (2019)3 point out the importance of considering the turnover of the existing fleet. Even if BEVs make up a large proportion of new car sales, their penetration of the existing fleet is much slower.
Between 2015 and 2019, approximately 4.7% of light duty vehicles in the U.S. were scrapped each year, and new car sales were 5.6% of the total number of LDVs. Even if the oldest cars were scrapped first, this would require a 20-year period to turn the vehicle fleet over. In reality, many newer cars are also scrapped each year for reasons such as accidents and natural disasters. So the time period for a complete fleet turnover is considerably longer.
A further complicating factor in estimating fleet transition from ICE to EVs is the difference in cost and capabilities for EVs at present. While most of this discussion is centered on ‘range anxiety,’ the pace at which BEVs can recharge, and their effect on the classical American road trip, more important limitations emerge in cost and performance when considering light-duty trucks used for commercial purposes.
In recent testing, Motortrend4 found that a Ford F-150 Lightning, with the extended range battery pack, struggled to tow a 7,000-pound trailer more than 100 miles per charge, compared to the observed 250+ miles in normal driving without a trailer. The culprit was as much aerodynamic as weight, as the ranges decreased much more slowly than trailer weight increased.
Further, the size of batteries needed to propel a light pickup mean both significantly higher cost (a minimum of $81,000 for a 2023 model with the extended range battery compared to $39,000 for similarly equipped gasoline-powered F-150) and battery charging time. Even at a DC fast charging station, recharging the battery from 10% to 80% requires approximately 40 minutes. A home recharge using a typical 240-volt outlet may require up to 20 hours, or 8 hours with an advanced high-current circuit and a specially installed charger.
None of this is to single out Ford. Similar results in other outlets have been obtained with the Rivian R1T and Hummer pickups.
The Role of PHEVs
Most EV mandates and announcements include wiggle room for plug-in hybrid electric vehicles (PHEVs). For liquid fuel demand, this is an important factor. PHEVs are capable of using either liquid fuels or grid power for transportation. Their fully-electric range is typically 30 to 50 miles, and this range should satisfy a large number of trips for typical American drivers. In practical usage, a recent German5 study found that the electric driving share for PHEVs is 45% to 49% for private vehicles and only 11% to 15% for company-owned vehicles. Though the study doesn’t explain the causes, lack of off-street parking for charging at home, lack of charging facilities at work, and the lack of financial incentive to charge for fleet vehicles as the employer likely pays for gas, are often seen as barriers to PHEV and EV charging.
The role of PHEVs is also important as the recently enacted Inflation Reduction Act contains large changes in EV tax credits. From January 2023 onwards, an increasing amount of the ‘critical minerals’ used in the battery must come from the U.S. or U.S. Free Trade partners. Half of the total $7,500 credit will hinge upon whether 40% (in 2023) to 80% (beyond 2027) of these minerals are sourced in the U.S. or a partner nation. The other half depends on the location of battery assembly.
Mineral production will likely remain constrained. Therefore, I believe that manufacturers will maximize the tax credits (often marketed as vehicle discounts) through using the available minerals to produce a greater number of smaller batteries for PHEVs rather than a smaller number of larger batteries for BEVs.
For comparison, PHEVs have 9 to 18 kilowatt-hour batteries, whereas car and crossover BEVs have 54-90 kilowatt-hour batteries. That means that for a given amount of battery capacity, 3 to 9 PHEVs can receive tax credits for each BEV that receives a tax credit. This scenario of manufacturers pushing toward more PHEVs than BEVs is even more likely given that the tax credit legislation now includes price caps on the vehicles that qualify.
The Role of Ethanol
Ethanol has long played a role as transport fuel, dating to the birth of the automobile. Its popularity grew dramatically in the late 1970s in response to the oil crisis, and again in the early 2000s in response to high oil prices and increasing environmental concerns about petroleum fuels and additives.
The early 2000s popularity culminated in the passage of the Energy Policy Act of 2005 and the Energy Independence and Security Act of 2007, which created the Renewable Fuels Standard (RFS). The RFS mandated increasingly larger levels of renewable fuels of various forms in the nation’s liquid fuel supply.


As a policy to stimulate a new market for consumption of domestic agricultural production, the RFS has been a success.
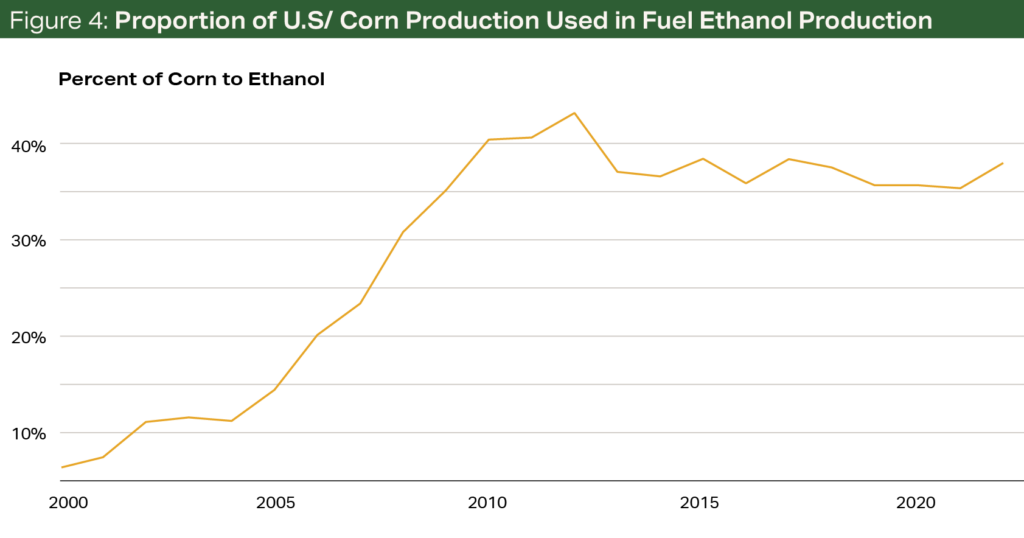
Prior to the passage of the Energy Policy Act in 2005, ethanol production consumed 12% of U.S. corn production, primarily as an oxygenate and additive to conventional gasoline. In 2011 and 2012, over 40% of U.S. corn production went to ethanol production, as rising RFS mandates stimulated a sharp rise in the number and capacity of plants.
Since that time, mandated ethanol consumption has been flat, but corn production has continued to rise, due to yield increases. In 2021, only 36% of corn production became ethanol.
The mechanism that the RFS uses to mandate ethanol inclusion is complex but can be summarized by that the EPA divides the number of gallons of ethanol mandated to be blended by the total number of gallons of motor fuel used. This percentage of mandated blending is then required for all gasoline blenders.
Blenders who blend and sell more than this percentage can sell the overage to blenders who do not meet this level through a system of trading blending credits. In recent years, this mandated blending level has hovered at 11% to 12%. While all vehicles are compatible with 10% blends, the additional demand must be absorbed through sales of higher blends, such as E15 or E85.
If BEV vehicles were to comprise a majority share of the vehicles in use in the U.S., gasoline demand would decline. This would mean that if RFS mandated levels remain unchanged, an increasing portion of ethanol would need to be sold as part of higher blends.
While vehicles newer than 2001 are compatible with E15, higher blends require a Flex Fuel compatible vehicle. Flex Fuel vehicles account for only about 7.5% of the vehicles in operation in 2022. Therefore rapid BEV adoption would have very real, adverse consequences on the demand for ethanol, and therefore, the demand for corn in the U.S.
The Future of Ethanol Demand in the U.S.
In the Annual Energy Outlook, the Energy Information Agency includes long-term projections for energy production, demand and prices, including for the transportation sector. Multiple cases are constructed using different assumptions and the results for each case are reported.
The 2022 AEO explores various oil price scenarios, each with somewhat different impacts on biofuel usage through 2050. But by and large, each story’s conclusion is no different: ethanol usage remains similar.
- In low oil price scenarios, ethanol usage increases, as increased overall fuel demand outstrips substitution effects.
- In high oil price scenarios, ethanol use decreases slightly, but biodiesel and renewable diesel demand more than offset those changes.
However, the 2022 AEO was released in March 2022, before the ACCII rule was adopted.
The AEO has 80% of sales of all new light duty vehicles in 2035 as gasoline powered. However, CARB states represent 40% of all new vehicle sales in the U.S. The worst-case BEV scenario would be a 60% share, with another 40% of sales accounted for by PHEVs.
Those sales levels in the CARB states translate to a minimum national new car market share for BEVs of 24% and PHEVs of 16%. Based on these rates, the total proportion of EVs in the national passenger car fleet would be between 6% and 10% by 2035 instead of 3.3% assumed under the AEO Reference case.
I estimate that this will result in an additional reduction in liquid fuel use of 2.9% to 5.8% compared to the AEO base case. That means a loss in roughly 500 million to 1 billion gallons of ethanol demand at a 10% blending rate.
By 2050, after 15 years of ACCII, I expect total EV vehicle stock in the U.S. to be more than 30% of the light duty vehicles in use, with proportional decreases in liquid and biofuel demand—or a 4.5 billion-gallon decline in domestic ethanol consumption.
Ethanol Opportunities
There remain opportunities for ethanol to defend and potentially expand its market share, namely by influencing automaker decisions and potentially legislation.


A primary opportunity is to expand flex fuel compatibility of a greater number of modern engines. As emissions and fuel economy standards have tightened, automakers have wrung increasing efficiencies out of ICEs through technologies such as high compression ratios, forced induction and direct injection. To effectively utilize these means to increase fuel efficiency, higher octane fuel is required to maximize combustion efficiency. In 2020, 51% of all models tested by the EPA required premium gas, compared to 41% requiring only regular gasoline. In 2010, those proportions were 37% and 53%, and in 2000, they were 28% and 69%.
Increasing numbers of vehicles requiring premium unleaded fuel could be important for ethanol consumption. Blends of 40% or more ethanol provide higher octane levels than premium gasoline. And more importantly, high-ethanol blends price well against premium gasoline. According to a recent AAA survey of gasoline prices, E85 sold at a 32% discount to premium, whereas it only sold at a 17% discount to regular gasoline.6
One of the challenges of E85 adoption has been its price differential to regular gasoline. Drivers can expect 23% lower fuel economy on E85 than regular unleaded7, which means that E85 needs to be priced 23% lower than gasoline to provide the same cost per mile of fuel.
But E85’s 32% discount to premium more than offsets the blend’s 23% lower fuel economy compared to premium gasoline. If more premium fuel vehicles are offered with flex fuel compatibility, it opens the door for E85 to become much more price competitive over much larger swaths of the U.S.
How much could this matter? For the gasoline vehicles still on the road in 2050, projected to be 60% to 70% of the total, if 10% of them used E85, this usage would more than offset any losses to EVs. That the CARB-aligned states are largely coastal means that in the remaining states, E85 is much more common with larger discounts to gasoline.
Conclusion
In recent years, there has been growing concern about the effect of EV adoption on the U.S. ethanol industry. Until the recent adoption of ACCII standards by California, most estimates were that consumer adoption would remain slow. The ACCII rulemaking, which is automatically adopted in 13 other states representing 40% of total new car sales, does make a bigger impact. However, the impact to ethanol consumption will not happen in 2030.
Due to the slow turnover of automobiles in the U.S., as well as the fact that a significant proportion of the EV requirements can be met by PHEVs, which do still use liquid fuel, demand changes by 2030 are unlikely to be meaningful.
By 2050, if current policies and assumptions hold, the impact could be much larger. Estimates indicate liquid fuel demand would drop by 25% or more from 2022 levels.
There nonetheless remains opportunities even now for ethanol to increase market share in the U.S. E85 could be a mechanically and economically superior substitute for premium gasoline, and a demand driver for ethanol through this transition.
1https://ww2.arb.ca.gov/our-work/programs/zero-emission-vehicle-program/about
2In EPA parlance, a light duty vehicle is a passenger car with a gross vehicle weight rating less than 8,501lbs, and a light duty truck is a truck with a GVWR under 8,501lbs. As many light duty trucks now substitute for cars, the term light duty vehicles will be used here to refer to both light duty passenger vehicles and light duty trucks.
3Hill et al., (2019) “The role of electric vehicles in near-term mitigation pathways and achieving the UK’s carbon budget” https://doi.org/10.1016/j.apenergy.2019.04.107
4https://www.motortrend.com/reviews/ford-f150-lightning-electric-truck-towing-test/
5https://theicct.org/publication/real-world-phev-use-jun22/
6See https://gasprices.aaa.com. On 26 October 2022, US average prices for regular/premium/E85 were $3.764, $4.525, and $3.094, respectively.
7Roberts, Matthew C., “E85 and fuel efficiency: An empirical analysis of 2007 EPA test data.” Energy Policy 36(3), pp 1233-1235. https://doi.org/10.1016/j.enpol.2007.11.006
Terrain content is an exclusive offering of AgCountry Farm Credit Services,
American AgCredit, Farm Credit Services of America and Frontier Farm Credit.