Report Snapshot
Situation
The processing tomato market has been on an incredible ride since the pandemic boosted at-home food spending at a time when inventory was low.
Outlook
Though the market is beginning to normalize, growers are likely to have a moderate return in the next few years.
Impact
At a time when many commodity prices in the Central Valley are near or below breakeven, processing tomatoes are likely to remain a good option for those farmers who are able to get a contract.
Juiced-Up Prices
After many years of low returns for processing tomato growers, the combination of higher at-home food spending during the pandemic and lower-than-typical inventory pushed nominal pricing in 2023 to its highest level on record. Whereas the price was $75 per short ton in 2019, 2023 prices were $138 for conventional and $190 for organic, per the California Tomato Growers Association (CTGA).
The higher price was a welcome change from the pre-pandemic period when oversupply kept prices roughly constant in nominal dollars but declining slightly in real dollars. Total supply and inventory, for instance, hit their peaks in 2016 but were on a downward trajectory until the 2023 crop reversed the trend. At the same time, stagnant pricing, lower productivity, and higher input costs across the board challenged growers’ ability to post positive returns in those years.
With the pandemic now in the rearview mirror, many processing tomato growers are wondering what the future holds.
It was always unlikely that the market would maintain the grower price highs of 2023. In fact, the CTGA price announcement of $112.50 per ton in 2024 is a sign of some normalization.
At the same time, it is also unlikely that there will be a quick return to the particularly low grower profits seen from 2015 to 2018 given several constraints on the supply side.
The net effect is likely to be more moderate returns in the next few years.
Background
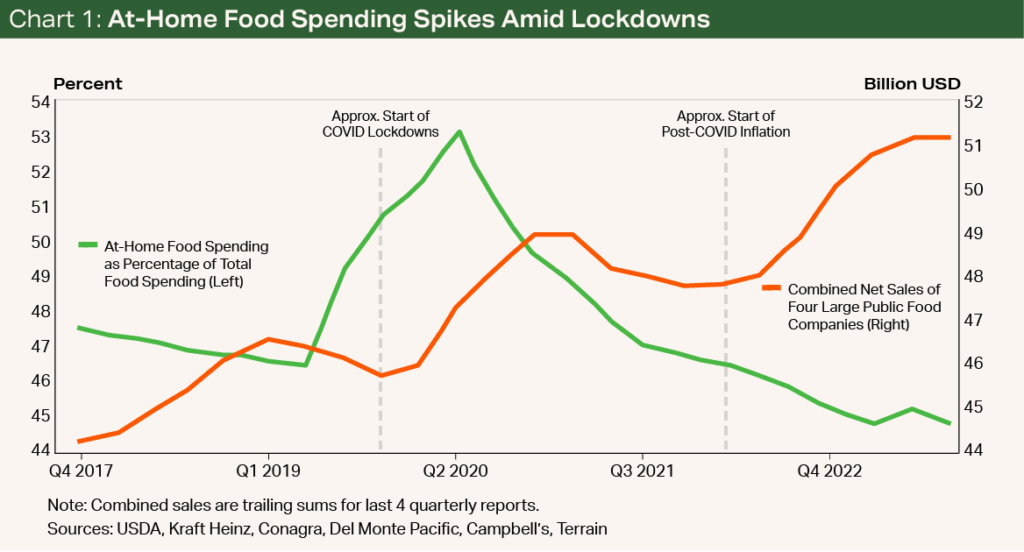
The surge in grower pricing for processing tomatoes was unforeseeable. When the COVID-19 lockdowns went into effect, the proportion of at-home food spending quickly went from the minority of food spending to the majority as consumers began “pantry stocking” to avoid multiple trips to the grocery store. Pantry items, many of which also happen to be processing tomato products, saw unexpected spikes in sales numbers. Once lockdowns took effect, the proportion of at-home food spending reversed its downward trend, jumping from around 46% to 53% (see Chart 1).

The supply of processing tomatoes was relatively constricted at this time. Total production in the years just before COVID-19 was on a downward trajectory, going from 14 million tons in 2014 to 11.2 million tons in 2019.1 Additionally, inventory got so low that imports of processing tomato products, which are typically negligible, have doubled in recent years.2 The mix of high demand and low supply caused the movement-to-inventory ratio — my own measurement of demand relative to supply — to quickly creep upward.
Unsurprisingly, this also meant much higher paste and grower prices. Whereas the price for tomato paste in pre-pandemic years was anywhere from 30 to 40 cents per pound, it climbed from around 30 cents in 2019 to about 90 cents in 2023.3 Similarly, whereas the grower price was mostly in the mid-$70s per ton from 2015 to 2018, it reached $84.50 in 2021, $105 in 2022 and $138 in 2023.4 While COVID wreaked havoc on many industries, it brought higher margins to California’s processing tomato industry.
Demand Is Normalizing
More recently, however, we’ve seen the movement-to-inventory ratio come down as well as the grower price, two signs of a market that may be returning to pre-pandemic trends. This return is likely to continue as the pandemic fades further into history and the industry once again faces the more typical conditions that have existed in the domestic and international market for decades. Because both markets are so distinct, it is easiest to discuss these markets separately.
On the domestic front, demand growth has been constant or negative depending on how it’s measured. In aggregate terms, processing tomato demand has been relatively flat since the early 1990s, according to data from both the USDA, which reports total availability, and the California League of Food Producers, which reports total movement.
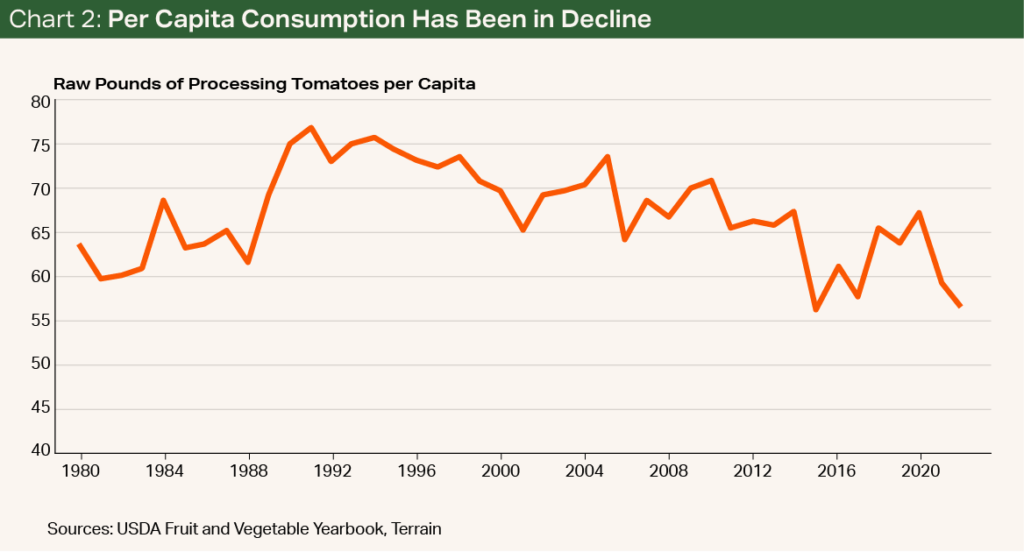
In per capita terms, however, consumption has been in decline.5 In the early 1990s, per-person consumption of processing tomatoes neared 80 raw pounds, but it has mostly been on a downward trajectory ever since, reaching approximately 57 pounds in 2022 (see Chart 2).

The main reason for the slowdown in domestic demand is that the market is much more developed than in other regions.6 As a result, per capita consumption in North America remains much higher than in any other market, meaning there may be less room for growth.
An additional factor may be that as Americans have sought out healthier food items, there’s been a shift to fresh vegetables over processed vegetables. The rapid increase in fresh produce availability, with imports coming in from Mexico and South America, appears to have accelerated this trend. Whereas other processed vegetables have experienced a similar decline in per capita consumption since 1980, fresh vegetable consumption has increased — primarily driven by items like leafy greens, spinach and asparagus (see Chart 3).


International demand, on the other hand, has been growing slowly, largely because of regions like the Asia-Pacific, Africa and the Middle East, and Latin America.7 As these regions become richer, they tend to demand more Western foods like pizza and pasta as well as ready-made meals, all of which are intensive in processing tomatoes.
Because the U.S. typically exports anywhere from 20% to 25% of production,8 it is intuitive to think increasing market share abroad could be a strategy for growing future demand. After all, this has been the strategy of other California commodities like almonds and pistachios, which export most production.
Yet U.S. tomato exports have struggled to grow in the last decade because of a more competitive global landscape, which hasn’t confronted almonds and pistachios in the same way. Countries such as China, Turkey, Brazil and Chile have begun to increase production and fill many markets that the U.S. might have otherwise supplied by increasing its exports.9 This is particularly true of China, which is now comfortably the largest exporter of tomato paste.10
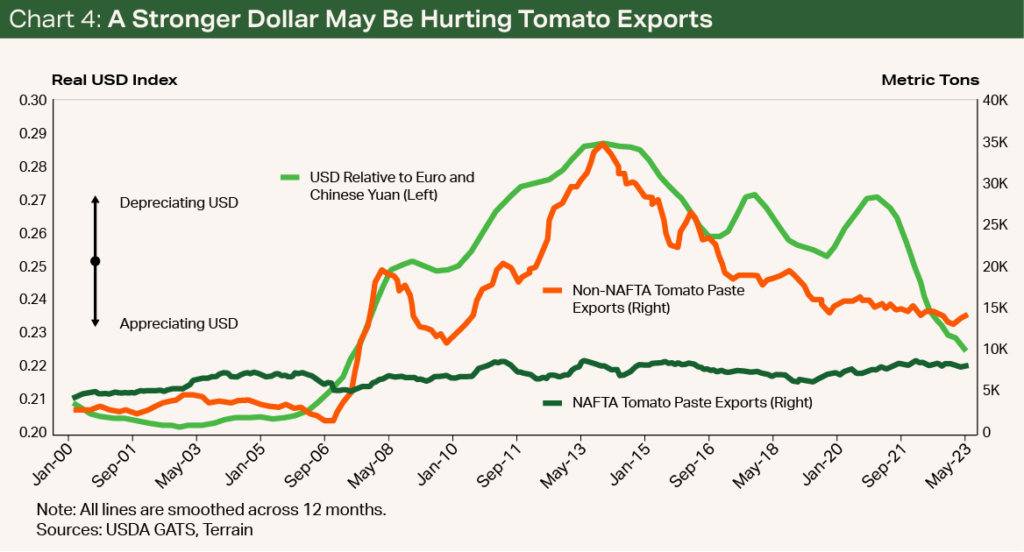
Making matters worse is the value of the U.S. dollar relative to the euro and the Chinese yuan. From 2000 to 2015, U.S. exports exhibited impressive growth (see Chart 4). Ever since, however, the value of the U.S. dollar relative to the euro and yuan has appeared to be a hinderance to growth overseas.11

California’s processing tomato industry will likely have to contend with slow demand growth at home and abroad again soon.
California’s processing tomato industry will likely have to contend with slow demand growth at home and abroad again soon. This will make it difficult for the recent spike in prices — whether it’s on the processor or grower side — to be maintained.
Though the pandemic reversed this trend briefly, there is little reason to think the trend reversal will continue. Instead, a return to pre-pandemic trends, which all else equal would put downward pressure on prices in coming years, is the most likely path forward.
Demand is important for determining price; however, it is only one side of the story.
Supply Constraints
Demand is important for determining price; however, it is only one side of the story. Just as challenges on the demand side may work to reduce prices, constraints on the supply side are likely to do the opposite. Some of the supply obstacles are new to the post-pandemic world, whereas others have been affecting the industry for decades. Though they aren’t independent of each other, the supply challenges can most easily be categorized as:
- Declining productivity
- Increasing costs
- The carrying cost of inventory
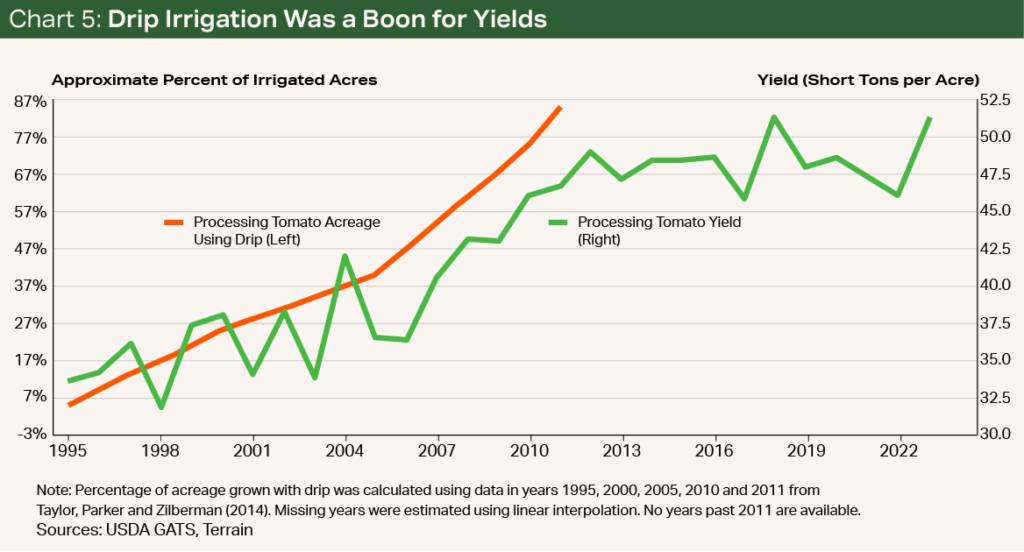
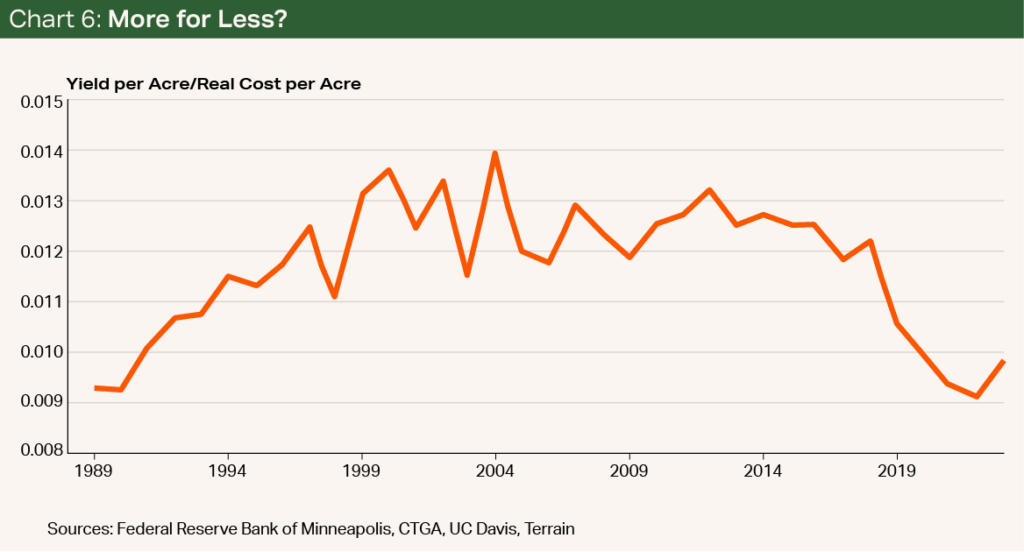
Starting with productivity, the processing tomato industry has experienced a decline in yield in the last decade. In historical terms, this follows the adoption of drip irrigation which, starting in the 1990s, took yields from just over 30 tons per acre to today’s yields of close to 60 tons per acre in some counties (see Chart 5). But with gains from drip largely behind us, an increased reliance on high-salinity groundwater (as opposed to low-salinity surface water), and increased pest pressure in drought years, yields have flattened or even declined in some years.

The problem of productivity is made worse by the second obstacle: an increasing cost structure in California (see Chart 6). According to the UC Davis cost studies, the real cash cost of producing tomatoes in 2023 dollars has almost doubled from the early 2000s to today. Cost increases have occurred across the board from water to labor to regulatory compliance to higher interest. Though growers have seen less expensive water in recent years, there are few signs that the overall cost burden will slow anytime soon.

Though there are a lot of factors that can reduce processing tomato inventory, it is striking how closely a higher interest rate is correlated with lower inventory.
A higher interest rate can also affect the processing side of the industry, which in turn will affect the growing side. Not only does this increase growers’ cost of using operating lines, but it makes it more expensive for processors to hold inventory and expand as they have done in previous years for the same reasons. Though there are a lot of factors that can reduce processing tomato inventory, it is striking how closely a higher interest rate is correlated with lower inventory (see Chart 7).
Given interest rates are likely to remain higher than they were just a few years ago for the foreseeable future, this may keep the supply-demand ratio more balanced with a more limited number of contracts in the marketplace. Securing contracts in the short term could be competitive, as some growers who have removed permanent plantings may try to shift into row crops.
Where Are We Headed?
What does all this mean for processing tomato growers in 2024 and beyond?
In the short term, there is no doubt that growers will need to have a higher yield to break even in 2024 than they did in 2023.


In the short term, there is no doubt that growers will need to have a higher yield to break even in 2024 than they did in 2023. Though yields and costs will differ grower to grower, we can back into break-even yields using UC Davis cost studies and CTGA price data. This exercise shows that whereas break-even yields were approximately 37 tons per acre in 2023, they will be closer to 47 tons per acre in 2024.


To put it simply, maybe processing tomatoes don’t stay red-hot, but they’re likely to stay hot enough.
Forecasting out three to five years is much more difficult. Nevertheless, I expect that the balance of normalizing demand and obstacles on the supply side will mean grower returns remain elevated relative to where they were in 2015 to 2018. Though demand has waned and is likely to return to pre-pandemic trends, there are too many constraints on the supply side for the high grower profits we’ve seen in recent years to completely dissipate. Furthermore, while inventory levels have ticked up after the large 2023 crop, they remain relatively low in historical terms.
To put it simply, maybe processing tomatoes don’t stay red-hot, but they’re likely to stay hot enough.
Works Cited and Notes
1 California Tomato Growers Association, “California Tomatoes for Processing,” https://ctga.org/statistics/
2 USDA Foreign Agricultural Service, https://apps.fas.usda.gov/gats/default.aspx
3 Morning Star, “Morning Star Tomato Paste and Processed Tomato Statistics,” May 2024,
https://www.morningstarco.com/wp-content/uploads/2024/05/...pdf
4 California Tomato Growers Association, “Tomato Bulletin,” https://ctga.org/bulletins-events/
5 Some of this decline is also due to the industry’s ability to produce more tomato paste with fewer raw tomatoes.
6 World Processing Tomato Council, “Consumption,” https://www.wptc.to/consumption/
7 Tomato News, “Global Market Report: Processed Tomatoes,” https://www.tomatonews.com/maj/upload/...
8 USDA Foreign Agricultural Service, https://apps.fas.usda.gov/gats/default.aspx
9 Tomato News, “World Trade 2021/2022 (May-April): Covid Continues to Have an Impact,” https://www.tomatonews.com/en/trade_46.html
10 UN Comtrade, https://comtradeplus.un.org/
11 USDA Economic Research Service, “Agricultural Exchange Rate Data Set,” https://www.ers.usda.gov/data-products/agricultural...
Terrain content is an exclusive offering of AgCountry Farm Credit Services,
American AgCredit, Farm Credit Services of America and Frontier Farm Credit.